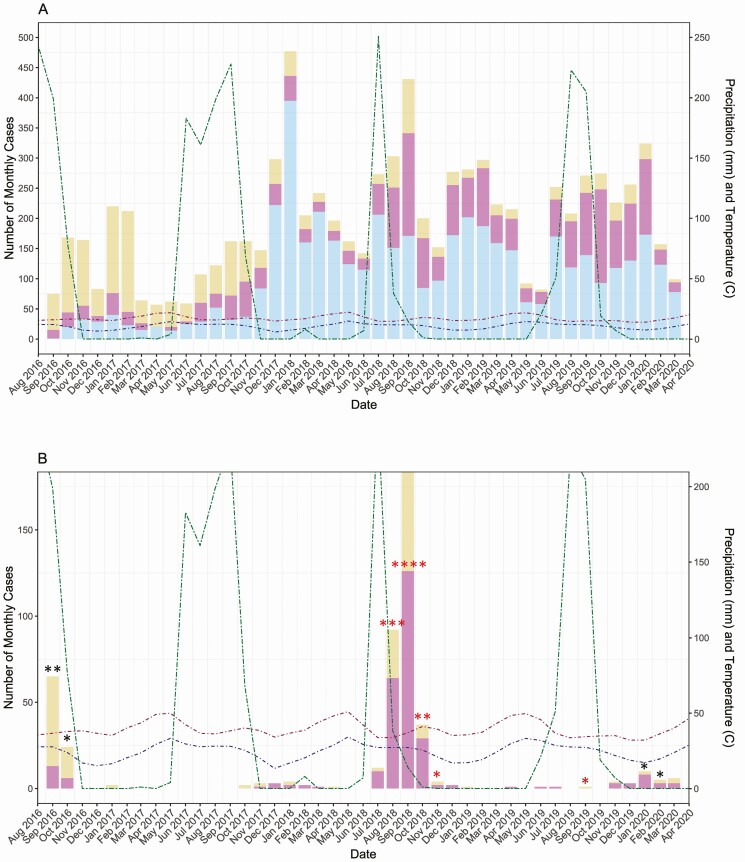
Figure 1.
Number of monthly cases of lower respiratory tract infections (LRTIs) from September 2016 through March 2020 in full-term and preterm infants. Monthly total precipitation in millimeters (mm) and monthly mean high and low temperatures in degrees °C are shown to reflect seasonal patterns of infection. (A) Number of monthly full-term cases of severe and very severe LRTIs. (B) Number of monthly preterm cases of severe and very severe LRTIs. (C) Number of monthly full-term cases associated with respiratory syncytial virus (RSV) infection. (D) Number of monthly preterm cases associated with RSV infection.

