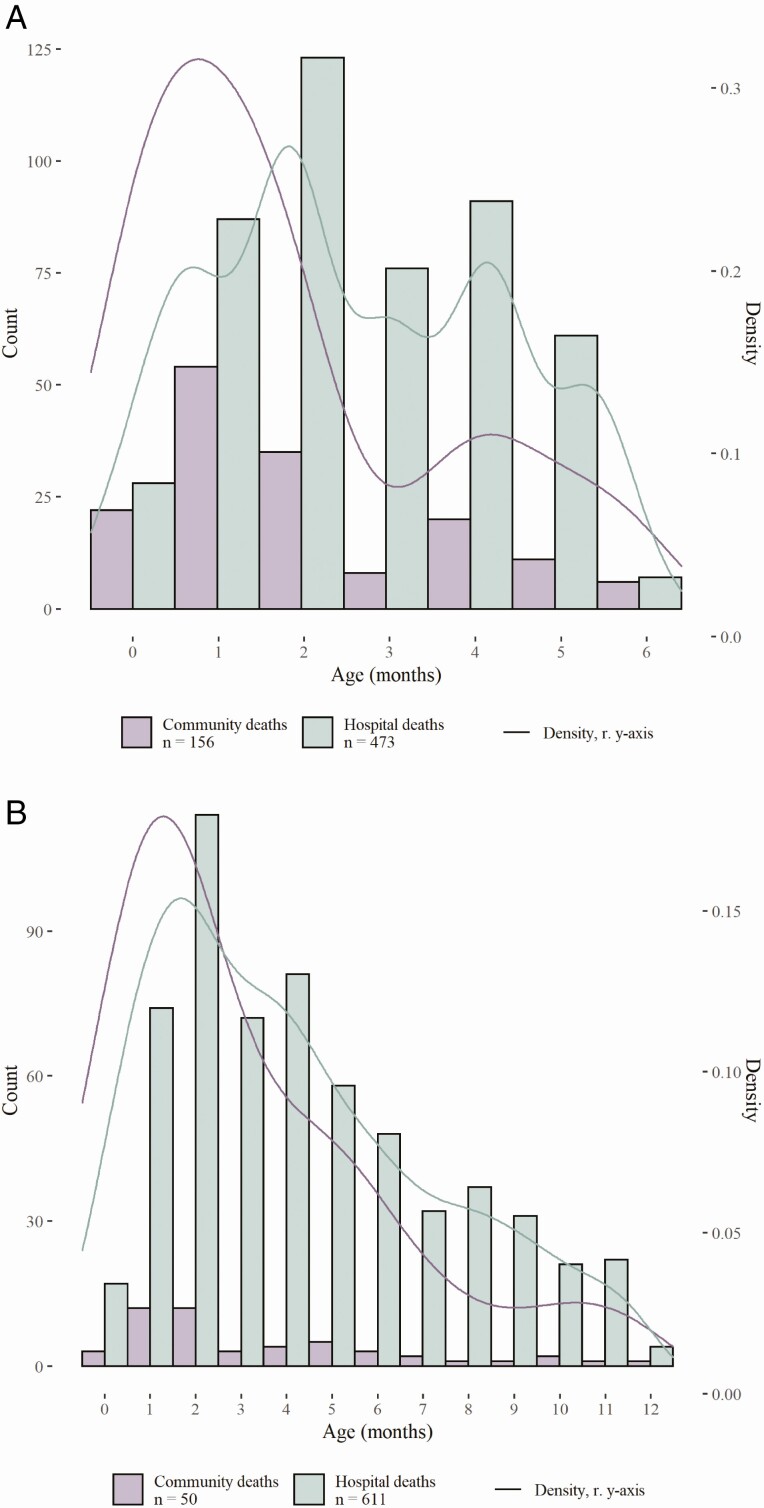
Figure 3.
A, Histogram and density plot of age at death for children under 6 months who died with RSV in the community compared with in-hospital in L(M)ICs and UMICs. The histogram shows number of deaths (count, left y-axis) shared to the registry by age at death in months (rounded to the nearest integer) from age 0 up to 6 months for all infants under 6 months of age. Lines show the kernel density estimate of age at death in months (density, right y-axis). Deaths that occurred in the community are shown in purple, while deaths that occurred in the hospital are shown in green. B, Histogram and density plot of age at RSV-related death for children under 12 months who died in the community compared with in-hospital in L(M)ICs and UMICs. The histogram shows number of deaths shared (count, left y-axis) to the registry by age at death from age 0 up to 12 months for the 12m cohort. Lines show the kernel density estimate of age at death in months (density, right y-axis). Deaths that occurred in the community are shown in purple, while deaths that occurred in the hospital are shown in green. Abbreviations: L(M)ICs, lower income and lower middle income country; RSV, respiratory syncytial virus; UMIC, upper-middle-income country.

