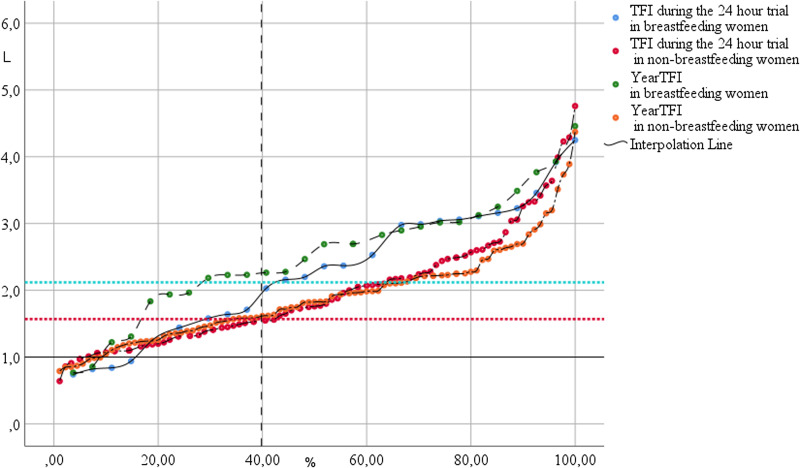
Fig. 2.
Overlay scatterplot of individual total fluid intake in litre (y-axis) split into breast-feeding and non-breast-feeding women. Percentiles on the x-axis. The two horizontal lines indicate the combined 40 percentile cut-off values of the 24 h trial (TFI) and estimates from the whole year (yearTFI) in non-pregnant, non-breast-feeding and breast-feeding women.

