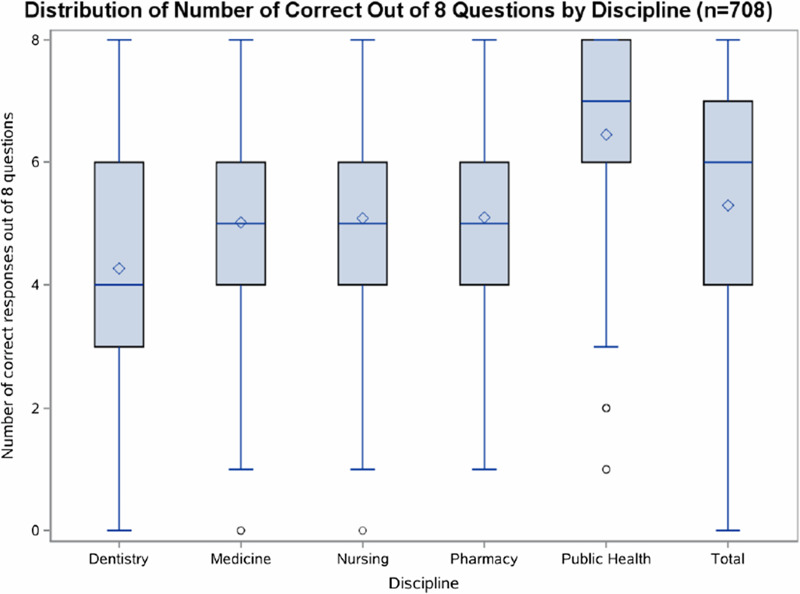
Figure 1.
Boxplots displaying distributions for number of correct responses out of 8 questions by discipline.*
*The upper and lower ends of the box are the upper and lower quartiles. The median is marked by a horizontal line inside the box. The mean is symbolized with a diamond. Circles indicate outliers.

