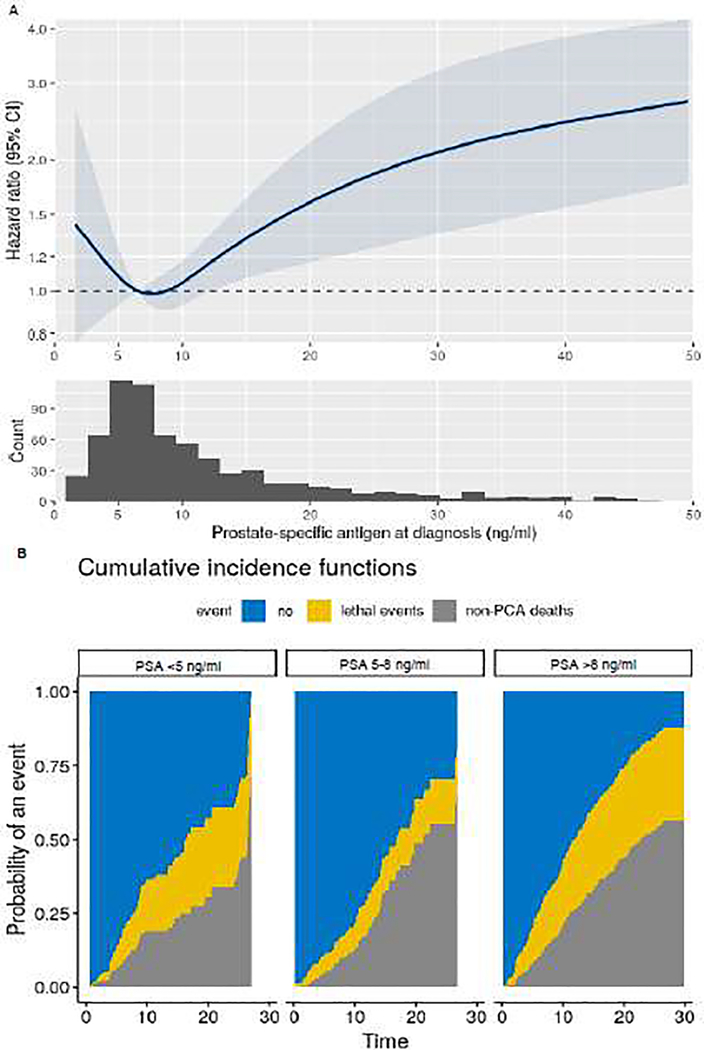
Fig. 1 –
Lethal prostate cancer (PCA) according to prostate-specific antigen (PSA) levels at cancer diagnosis among men diagnosed with localized, Gleason score 8–10 PCA between 1986 and 2015 within the Health Professional Follow-up Study. (A) Multivariable hazard ratios from Cox proportional hazards regression, with PSA modeled as a restricted cubic spline, adjusted for clinical stage, Gleason score, and treatment received. The solid curve represents point estimates and the highlighted blue area the 95% confidence interval (CI). (B) Cumulative incidence of lethal PCA (yellow) and all-cause mortality (gray) among men with high or low PSA levels compared to men with intermediate PSA levels.

