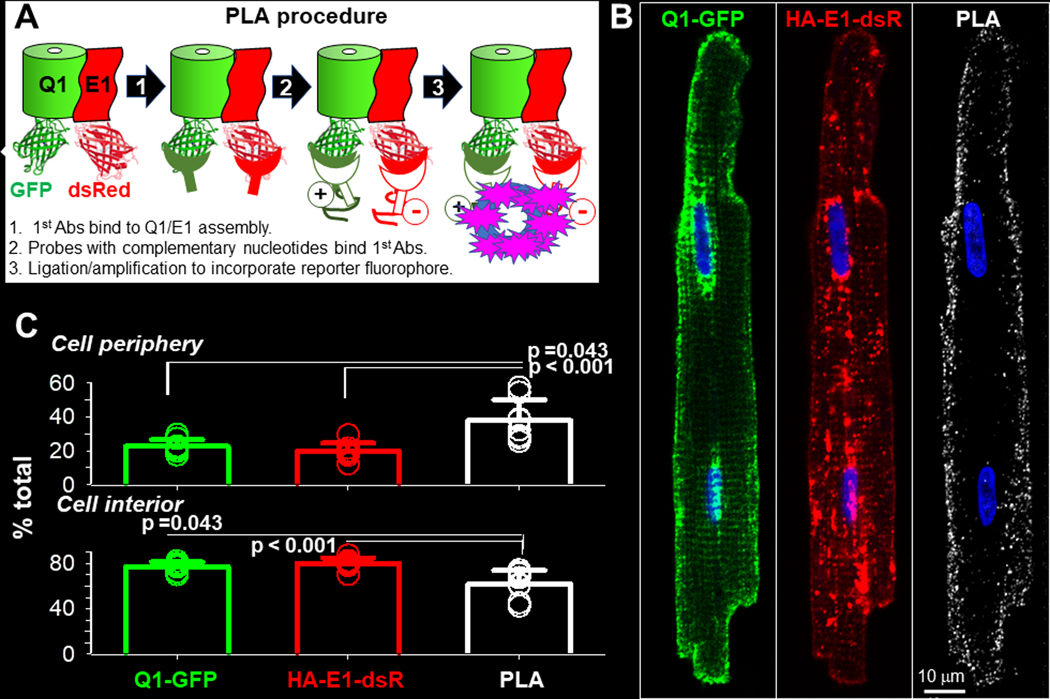
Fig. 2. Localize KCNQ1/KCNE1 assembly in cardiac myocytes by in situ proximity ligation assay (PLA).
Rat ventricular myocytes transduced with Q1-GFP and HA-E1-dsR were cultured for 24–36 hr before experiments. (A) Diagram of PLA procedure. Primary antibodies (1st Abs) were GFP mouse Ab and dsRed rabbit Ab, binding to the FP tags in the cytoplasmic compartment. At sites where the 1st Abs were ≤ 40 nm apart, binding of nucleotide-conjugated PLA probes to the 1st Abs allowed nucleotide ligation and amplification. During the latter reaction, far red fluorophore was incorporated to mark these sites. Not shown in the diagram: after PLA procedure, myocytes were incubated with Alexa488 goat anti-mouse and Alexa568 goat anti-rabbit Abs to label total Q1-GFP and HA-E1-dsR. (B) Representative images of Q1-GFP, HA-E1-dsR and PLA (pseudo-colored white) from a myocyte. To better appreciate the 3D distribution pattern of PLA signals in the myocyte, the PLA image is shown as z-projection of maxima. A total of 29 Z-slices was acquired, and 20 Z-slices (excluding the bottom 6 and the top 3 slices to avoid interference by cell surface PLA signals) were used to create the z-projection. (C) Quantification of Q1-GFP, HA-E1-dsR and PLA signals in cell periphery and cell interior. Cell periphery was defined as an area 2 um wide within the cellular contour, while cell interior was the area within cell periphery. Shown are data points from individual myocytes (symbols, 8 myocytes from 2 hearts) and mean±SD (bar graphs). The three groups of data were subject to one-way ANOVA (p=0.001), followed by Tukey pairwise tests. PLA signals have higher % in cell periphery, and lower % in cell interior, than Q1-GFP and HA-E1-dsR.

