. 2021 Feb 8;5(1):e18050. doi: 10.2196/18050
©Pauline Huynh, Rongzi Shan, Ngozi Osuji, Jie Ding, Nino Isakadze, Francoise A Marvel, Garima Sharma, Seth S Martin. Originally published in JMIR Cardio (http://cardio.jmir.org), 08.02.2021.
This is an open-access article distributed under the terms of the Creative Commons Attribution License (https://creativecommons.org/licenses/by/4.0/), which permits unrestricted use, distribution, and reproduction in any medium, provided the original work, first published in JMIR Cardio, is properly cited. The complete bibliographic information, a link to the original publication on http://cardio.jmir.org, as well as this copyright and license information must be included.
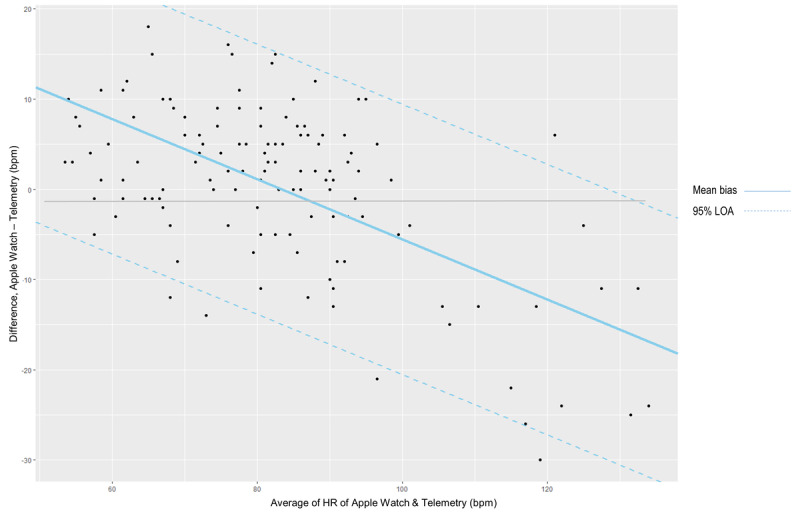
Figure 3.

Bland–Altman plot showing 95% confidence limits with progressive increase in differences.
