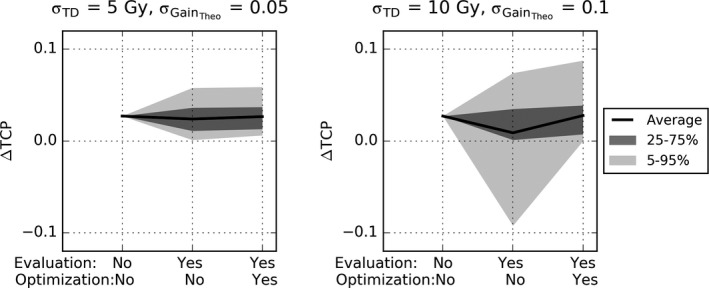
Fig. 4.

∆TCP for all patients for moderate (left) and considerable (right) uncertainty in radiosensitivity. The x‐axis indicates whether uncertainty was accounted for to calculate the TCP (evaluation) and whether it was accounted for in the optimization. The solid lines represent the mean expected TCPs over all 12 patients. The shaded areas represent 50% and 90% of the cases.
