
Figure 3.
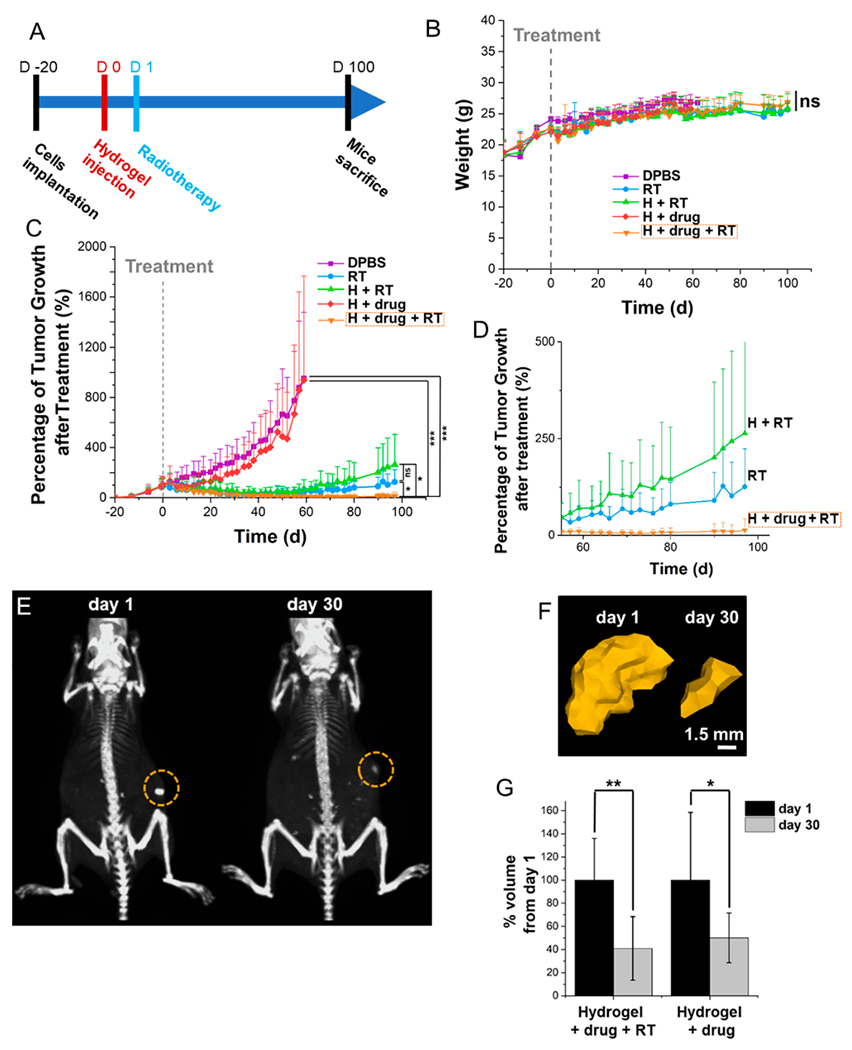
In vivo evaluation of the antitumoral effect of the quisinostat loaded Se-PCPP hydrogel and tolerability over 100 days, as well as in vivo hydrogel monitoring by CT. (A) Experimental design and evaluation of the (B) mouse weights and (C) tumor growth over 100 days. (D) Data shown in panel C with a focus on 55–100 days post treatment. (E) CT scans at 1 h and 30 days postinjection; the circles indicate the hydrogel. The windows level is 575 HU and the window width is 1250 HU. (F) 3D reconstructions of the hydrogel based on CT images. The AuNP loaded hydrogel was artificially colored in gold based on intensity thresholding using the same windows level and width as in A. (G) Quantification of the hydrogel degradation by comparing the volume change (n = 6).*, **, and *** indicate a difference at p < 0.05, 0.01, or 0.001, respectively, while ns indicates a nonsignificant difference.