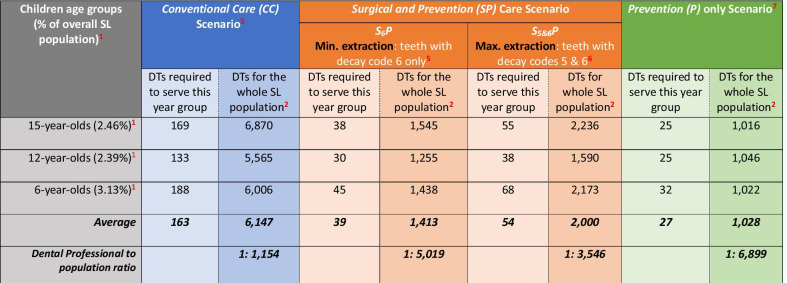
Table 4.
Estimated DTs required in 6-,12- and 15-year-olds and extrapolated for whole SL population according to different scenarios of care delivery
1Estimated population % of each age group of children within overall SL population (n = 7,092,113) informed by 2015 SL Census data
2Estimated dental therapists (DTs) calculated considering them working full time for 46 weeks in a year for overall SL population (n = 7,092,113)
3‘Conventional care’ scenario includes oral health promotion and prevention (shaded green), restoration (shaded orange) and extraction (shaded dark orange) as shown in Table 2
4‘Surgical and Prevention care’ scenario oral health promotion and prevention (shaded green) and extraction (shaded dark orange) only, as shown in Table 2
5Sub-type of ‘Surgical and Prevention’ scenario in which only teeth with decay code 6 will be managed with extraction along with oral health promotion and preventative strategy
6Sub-type of ‘Surgical and Prevention’ scenario in which teeth with decay codes 5 and 6 will be managed with extraction along with oral health promotion and preventative strategy
7‘Prevention care only’ scenario includes only oral health promotion and prevention (shaded green), as shown in Table 2, and no other treatment modality

