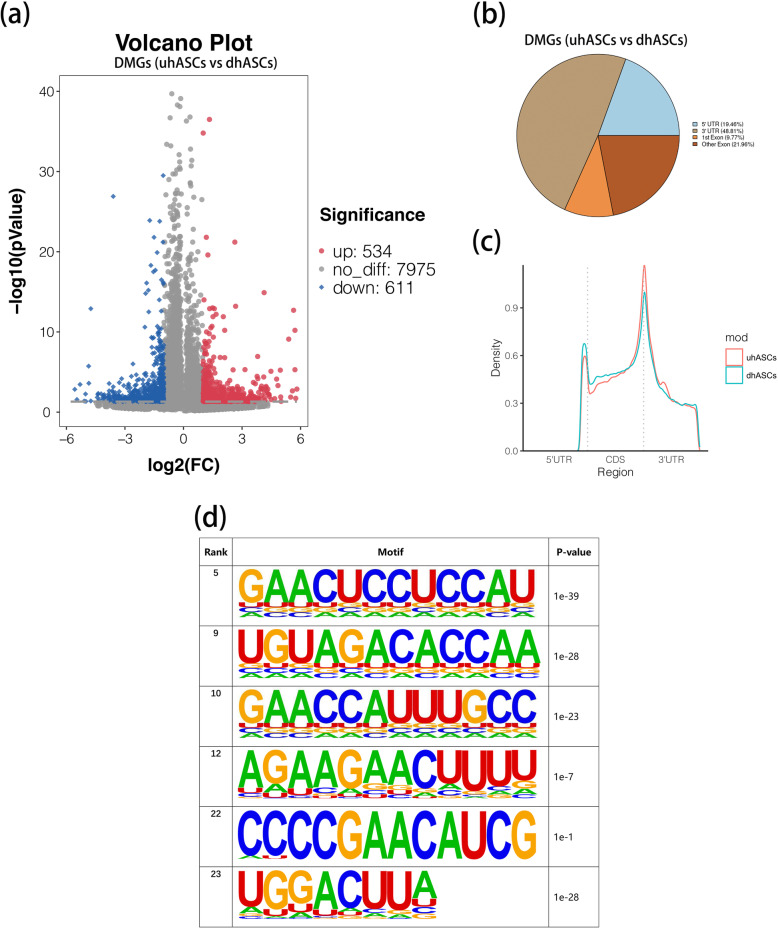
Fig. 3.
m6A peaks were significantly dysregulated during osteogenesis of hASCs. a Volcano plot displaying the DMGs (fold change ≥ 2 and p < 0.05). b Pie chart showing distribution of differentially methylated m6A peaks in different gene contexts. c Accumulation of differentially methylated m6A peaks along transcripts. d The m6A motifs significantly enriched across m6A peaks identified between uhASCs and dhASCs. DMGs, differentially methylated genes; hASCs, human adipose-derived stem cells; uhASCs, undifferentiated hASCs; dhASCs, osteogenically differentiated hASCs; FC, fold change

