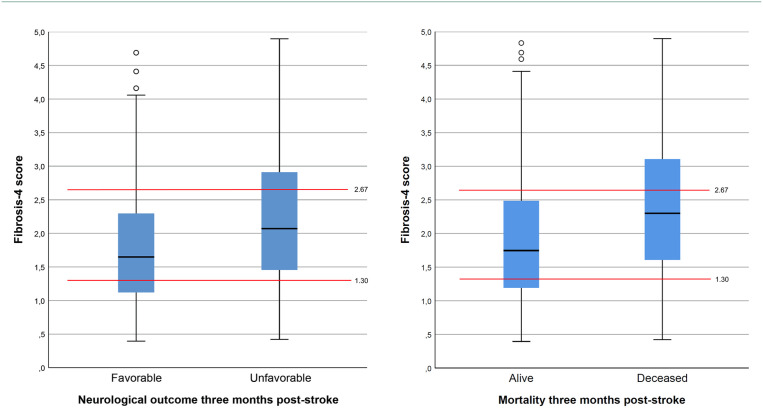
Figure 2.
Boxplot of Fibrosis-4 index and clinical outcomes at three months post-stroke.
Red lines depicting the established upper (2.67) and lower (1.30) cut-off values for inclusion and exclusion of liver fibrosis, respectively. Black line depicting the median value, blue boxes showing the 25th and 75th percentiles.

