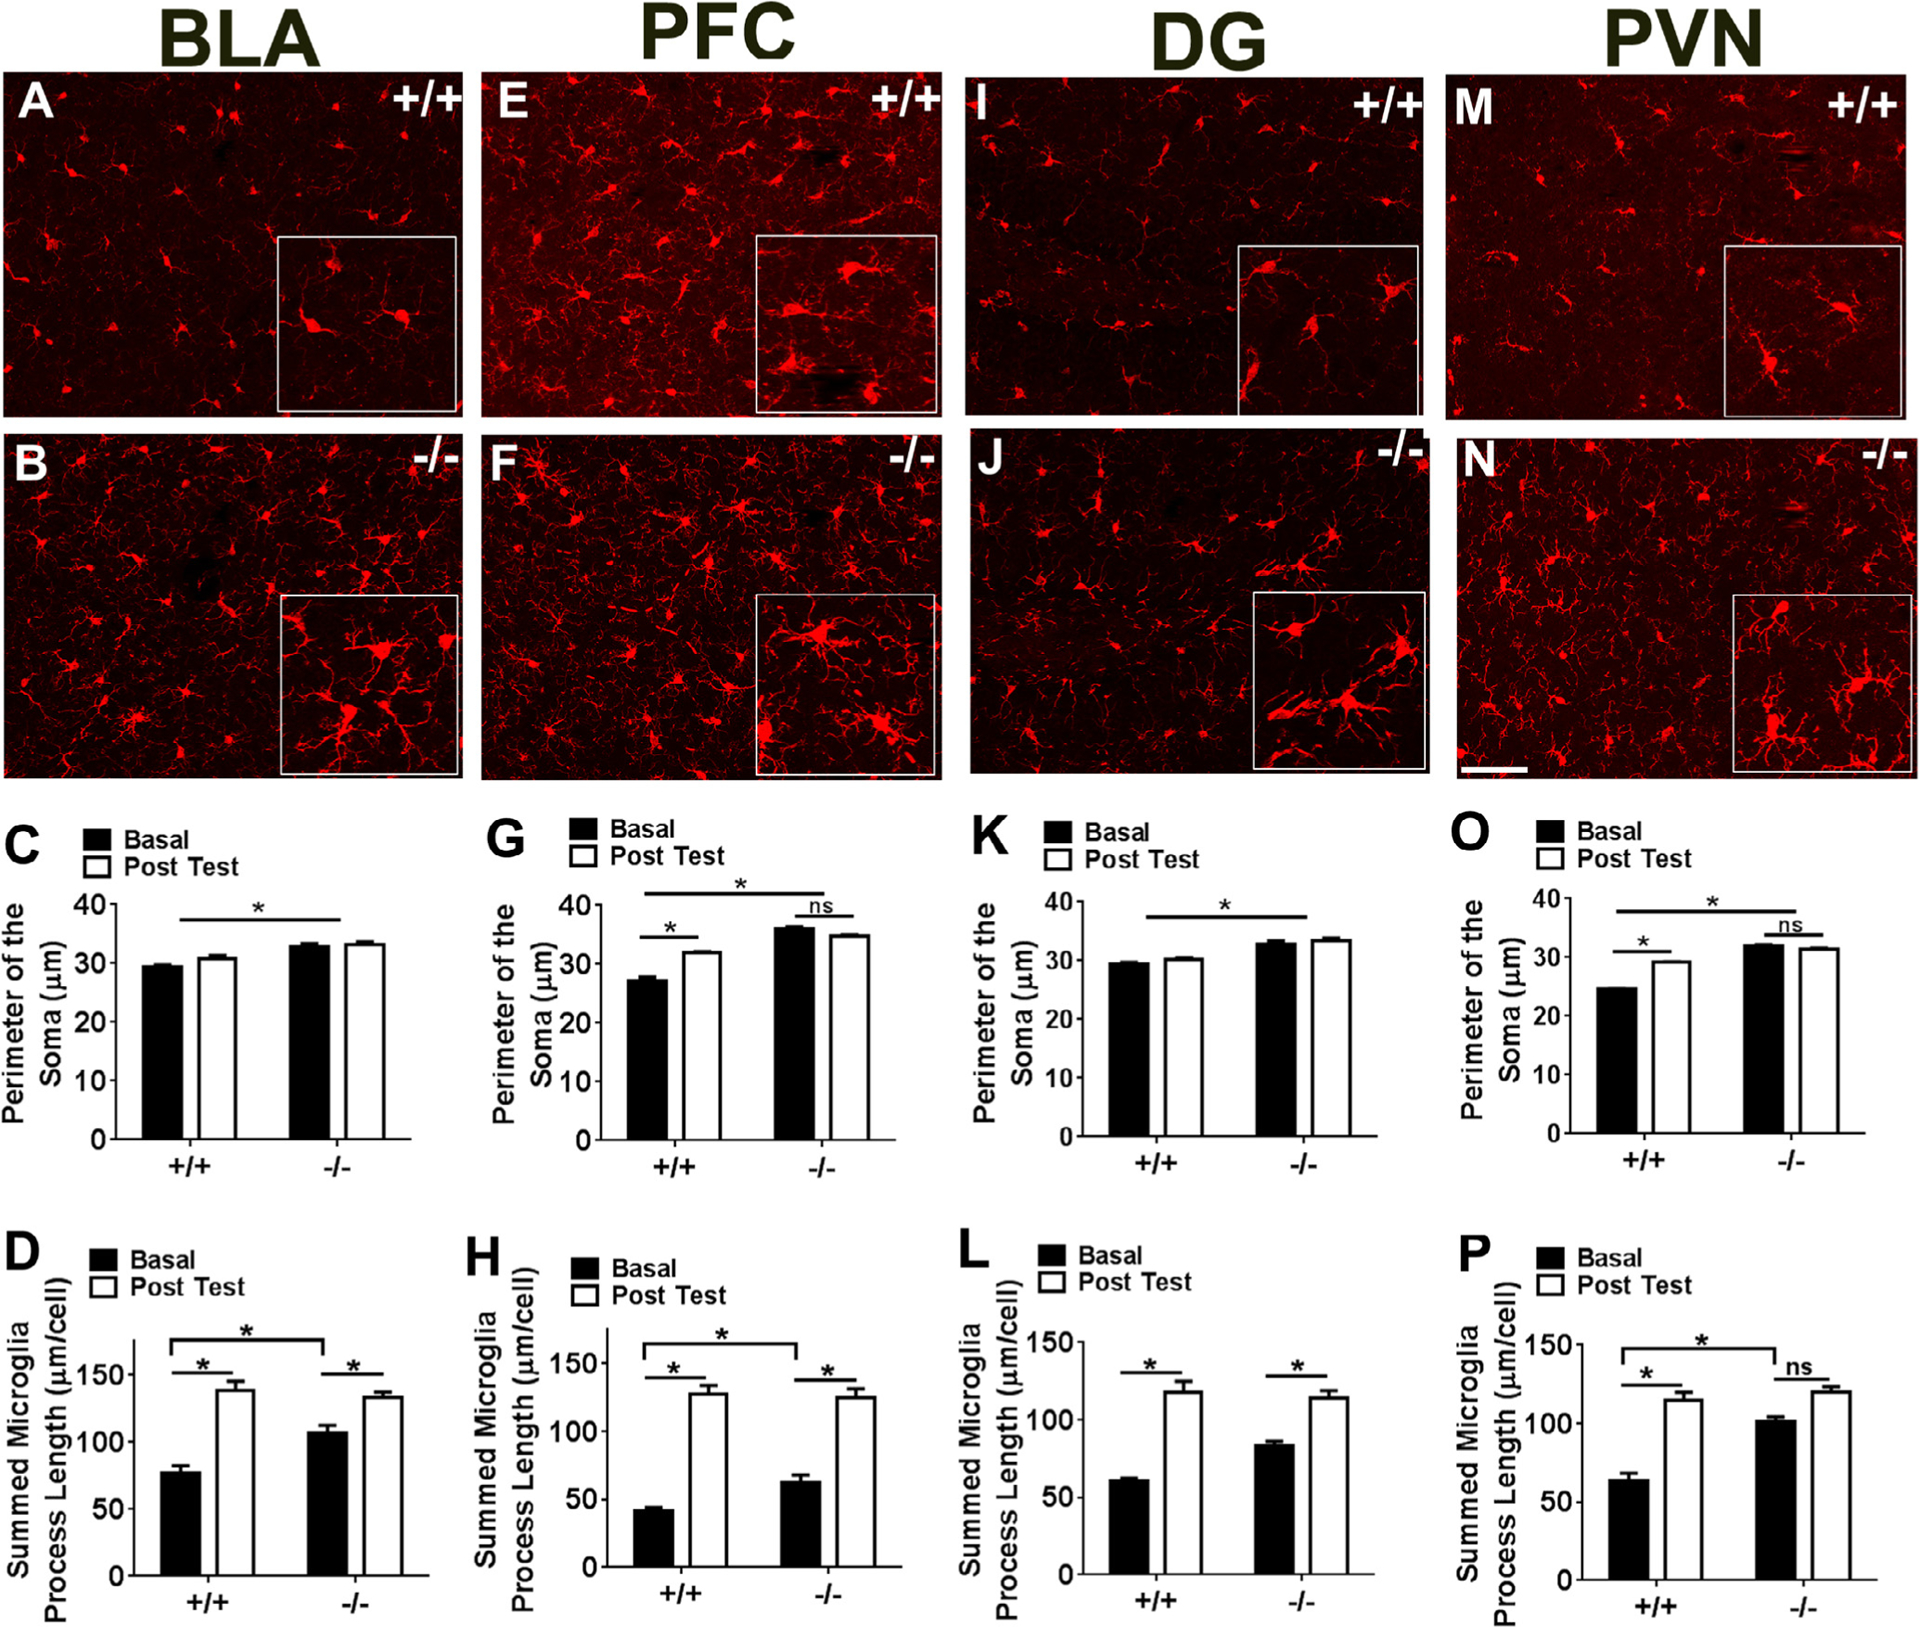
Fig. 2.

Morphological analysis of microglia in CX3CR1 deficient (−/−) and wild type (+/+) mice within forebrain limbic sub-regions. Images show IBA-1 (ionized calcium binding adaptor molecule 1) stained microglia within the basolateral amygdala, BLA, (A, B), pre-frontal cortex, PFC (E, F), dentate gyrus, DG (I, J), and hypothalamic paraventricular nucleus, PVN (M, N). Insets show magnified area within the image. Bar graphs show quantified soma perimeter (C,G,K, O) and branch length (D,H,L,P) within these areas under basal, home cage conditions (basal) and following completion of behavioral testing (post test). Data are represented as mean +/− sem; *p < 0.05 versus basal +/+ or basal −/− as depicted by lines. (n = 6–12 mice per group; ns = not significant).
