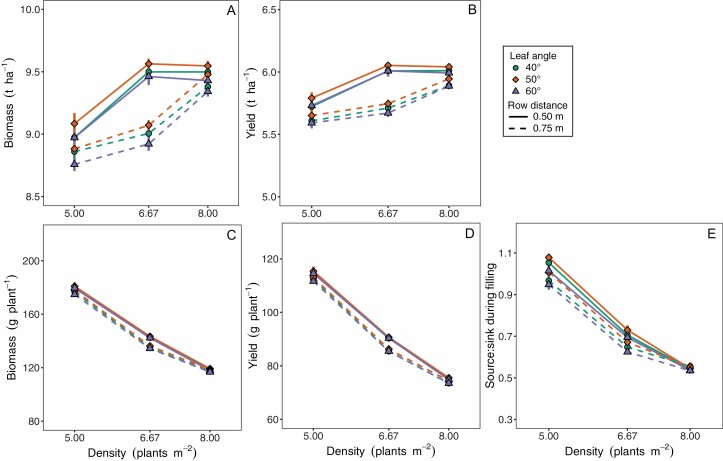
Fig. 6.
Simulated biomass productivity, yield and source-sink ratio of maize grown at different plant densities. Results are shown at field (A, B) and plant level (C, D) as means ±SD of 4–5 simulations. Source: sink ratio (E) was calculated during the grain-filling period. Input parameters were varied to simulate different leaf declination angles of 40°, 50°, and 60° (different symbols); and common row distances (Li et al., 2015; USDA, 2020b) of 0.50 m (solid line) and 0.75 m (dotted line). For a full description of the model and parameters, see Evers and Bastiaans (2016).

