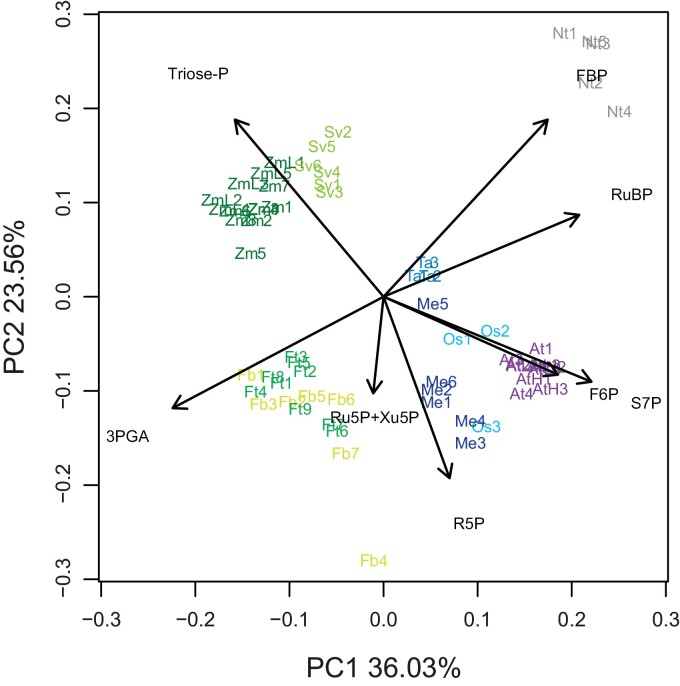
Fig. 2.
Principal component analysis of CBC metabolite profiles in four C4 and five C3 species. Metabolite amounts were transformed by multiplying the amount of a given metabolite (nmol g FW−1) by the number of carbon atoms in the metabolite to estimate the carbon equivalent content (nmol C g FW−1), and then dividing this by the total carbon equivalents in all CBC intermediates plus 2PG. This transformation generates a dimensionless dataset in which each metabolite receives a value equal to its fractional contribution to all the carbon in CBC metabolites plus 2PG. This removes potential bias due to differences in leaf composition. Note that SBP was excluded from the PC analysis shown here because some species appear to contain a subpool of SBP that is not involved in CBC flux (see Arrivault et al., 2017, 2019). The result was, however, not changed greatly when SBP was included (not shown). The distribution of C4 species (shades of green) and C3 species (shades of blue and grey) is shown on PC1 and PC2 (Z. mays/maize, Zm and ZmL; S. viridis, Sv; F. bidentis, Fb; F. trinervia, Ft; O. sativa/rice, Os; T. aestivum/wheat, Ta; A. thaliana/Arabidopsis, AtL, AtM, and AtH; N. tabacum/tobacco, Nt; M. esculenta/cassava, Me). Each species occupies its own space, except for the two Flaveria species which overlap. For Arabidopsis, L, M, and H refer to samples harvested after 15 min in low, medium (=growth), and high light (80, 120, and 280 µmol m−2 s−1, respectively). For maize, ZmL and Zm refer to samples harvested after 4 h at low irradiance or left at growth irradiance, respectively (160 µmol m−2 s−1 and 550 µmol m−2 s−1). Samples group independently of the harvest irradiance. The weightings of CBC intermediates in PC1 and PC2 are shown in black. The display is modified from Arrivault et al. (2019). Metabolite abbreviations are as in Fig. 1.

