Fig. 3.
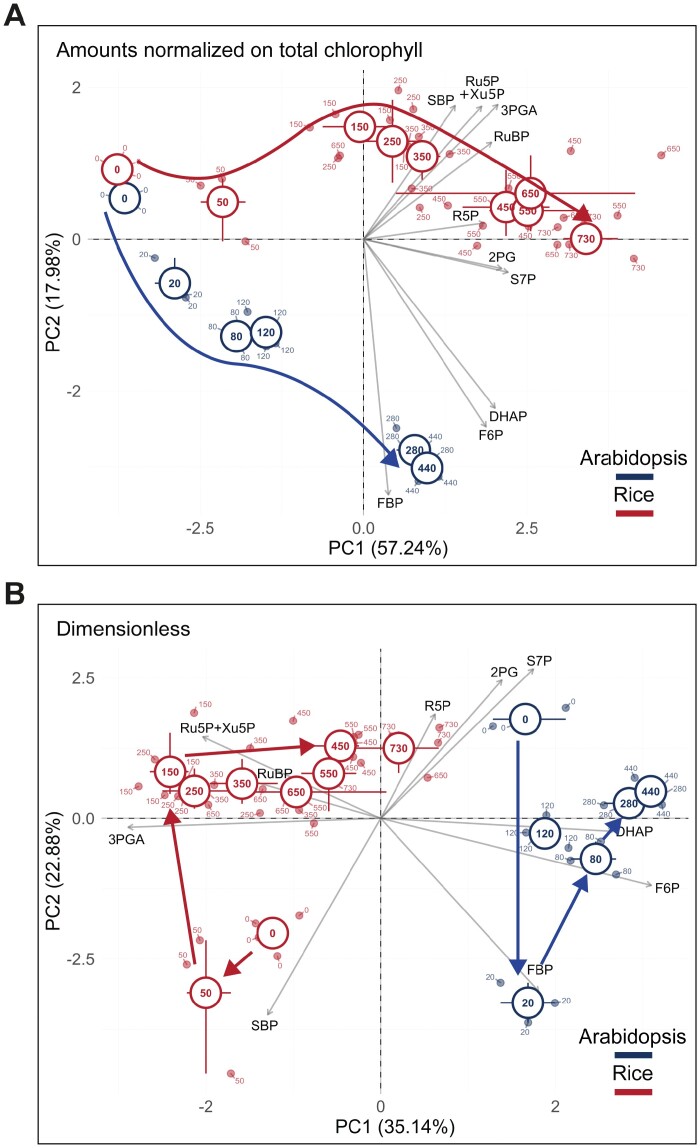
Principal component (PC) analysis of the response of Arabidopsis and rice to rising irradiance. Samples were collected in darkness and at 20, 80, 120, 280, and 420 µmol m−2 s−1 irradiance in Arabidopsis (shown in blue) and in darkness and at 50, 150, 250, 350, 450, 550, 650, and 730 µmol m−2 s−1 in rice (shown in red). The lowest irradiance intensity was close to the light compensation point and the others were ~67, 100, 230 and 360% in Arabidopsis and ~30, 60, 80, 100, 120, 150, and 170% in rice of that required to half-saturate photosynthesis (not shown). Positions of individual samples at each irradiance are indicated by the corresponding number in small font. The plots show PC1 and PC2 for analyses performed on (A) chlorophyll-normalized data and (B) a dimensionless dataset (see legend to Fig. 2). The average of these samples in the space defined by PC1 and PC2 is indicated by a circle (irradiance in large font) and the 95% confidence limits are depicted by bars. Metabolite loadings are depicted as grey arrows, and the respective metabolite is shown in black font. The thick red and blue lines show the response of rice and Arabidopsis to increasing irradiance. The unusual asymmetric distribution of loadings in PC1 in the PC analysis with chlorophyll-normalized data reflects a general increase in the levels of most metabolites as irradiance increases. Species-specific responses are captured in PC2 where rice and Arabidopsis take different trajectories as irradiance increases. The masking effect of the general rise in metabolite levels is removed when metabolites are normalized on total carbon content in CBC metabolites at that light intensify (B). This plot reveals that CBC metabolites occupy a different metabolic space in rice and Arabidopsis that is largely independent of irradiance. Note also that the ‘outlier’ at low irradiance at around the light compensation point that is captured in PC2 and is driven by high FBP and high SBP contributes to the separation in PC1. The display is modified from Borghi et al. (2019). Metabolite abbreviations are as in Fig. 1.

