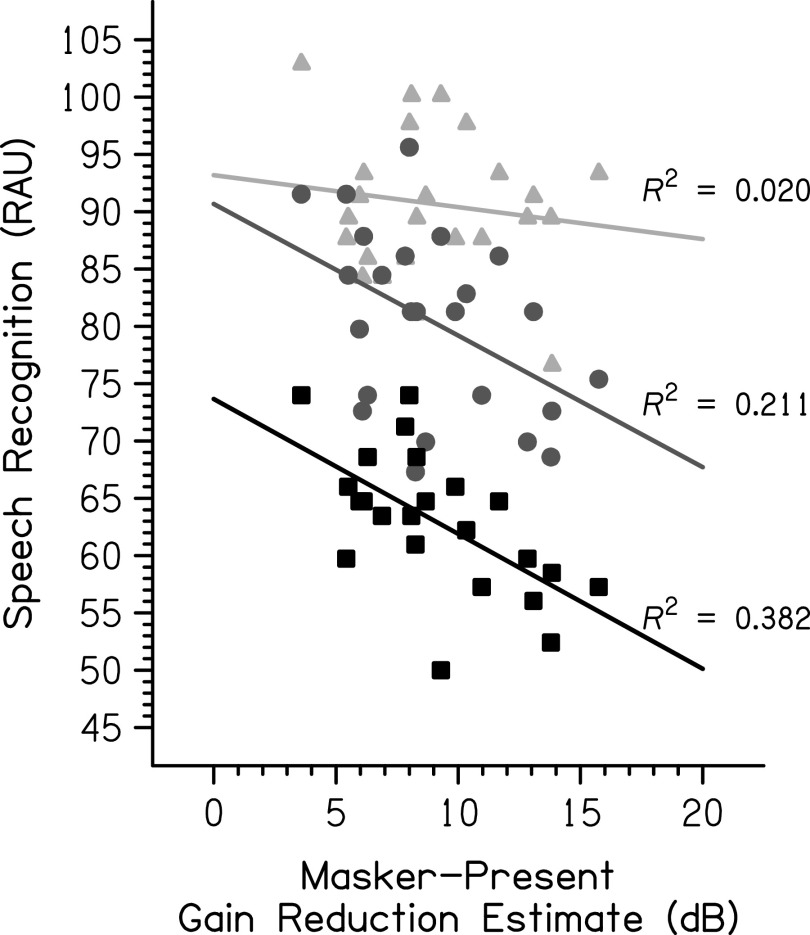
FIG. 3.
The relationship between psychoacoustic gain reduction estimates and speech recognition by SNR is shown. The light gray triangles represent individual data at +3 dB SNR, the medium gray circles represent individual data at 0 dB SNR, and the black squares represent individual data at −3 dB SNR. R2 is larger with a decreasing SNR.

