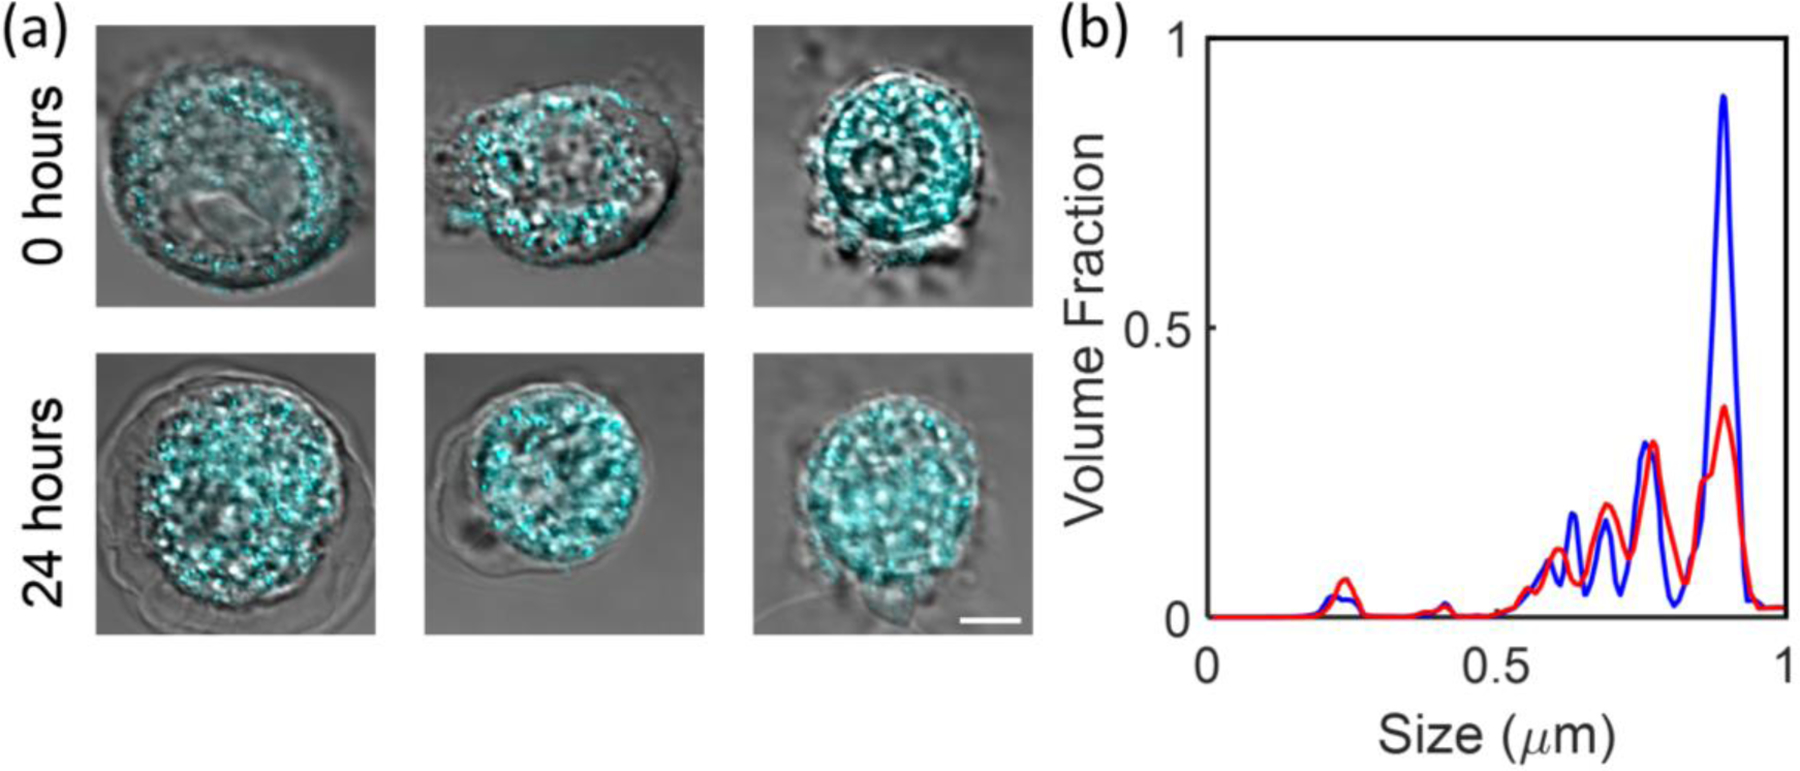
Figure 6.

Coherent CLASS microscopy quantifies cancer progression in live cells. (a) High resolution confocal reflectance microscopy images (cyan) overlaid on the transmission images of three esophageal CP-A cells before treatment and the same three cells after 24-hour NNK carcinogen treatment. (b) Size distributions reconstructed from coherent CLASS microscope data, averaged over five cells before treatment (blue) and after 24-hour NNK carcinogen treatment (red). Scale bar equals 5 µm.
