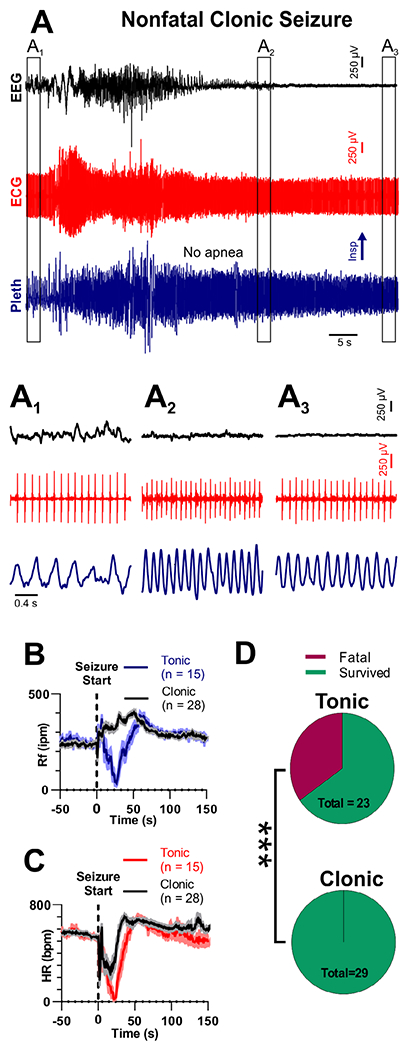
FIGURE 4:

Clonic seizures do not produce death or apnea. (A) Recording of electroencephalogram (EEG), electrocardiogram (ECG), and plethysmogram (Pleth) during a clonic seizure in a W/+Emx1-Cre mouse. (A1–A3) Expanded views of boxes in A, depicting EEG, ECG, and breathing prior to, during, after the seizure. (B) Respiratory frequency (Rf) and (C) heart rate (HR) binned every second from 50 seconds before to 150 seconds after seizure initiation for tonic and clonic seizures. (D) Pie charts show tonic seizures are more likely to cause fatality than clonic seizures (***p = 0.007, 2-sided Fisher exact test). For B and C, solid lines represent mean, and shaded regions represent standard error of the mean. bpm = beats per minute; Insp = inspiration; ipm = inspirations per minute.
