
FIGURE 7:
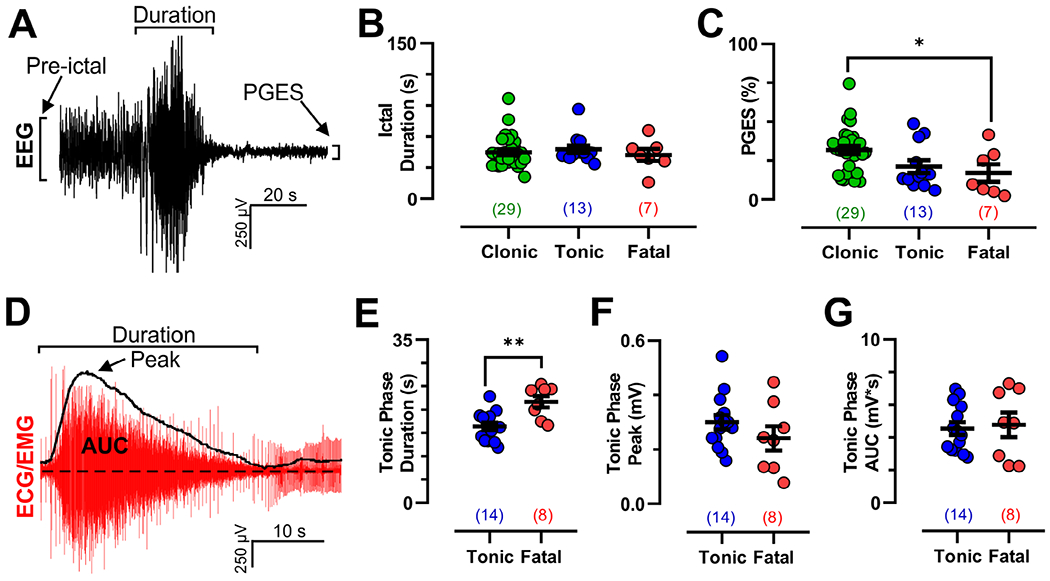
Electroencephalographic (EEG) and electromyographic (EMG) dynamics are similar for fatal and nonfatal tonic seizures in W/+Emx1-Cre mice. (A) Depiction of seizure duration, preictal amplitude, and postictal generalized EEG suppression (PGES) amplitude measurements from a peri-ictal EEG trace. (B) Seizure duration was no different across the 3 observed seizure types (Kruskal–Wallis test, K = 1.166, p = 0.5583). (C) PGES amplitude (as a fraction of preictal amplitude) was smaller for fatal compared to clonic seizures; however, there was no difference between tonic and fatal seizures (p = 0.0373 by Dunnett multiple comparison test after significant 1-way analysis of variance, F2,45 = 4.065, p = 0.0238). (D) Depiction of tonic phase duration, peak amplitude, and area under the curve (AUC) measurement from a peri-ictal electrocardiogram (ECG)/EMG trace from a tonic seizure. (E–G) Tonic phase duration was longer for fatal seizures (p = 0.0013, T = 3.729, df = 20, unpaired t test); however, there was no detectable difference in peak (p = 0.2407, T = 1.209, df = 20, unpaired t test) or AUC EMG activity (p = 0.7583, T = 0.3120, df = 20, unpaired t test). *p < 0.05, **p < 0.01. Values in parentheses indicate number of seizures analyzed in that dataset.