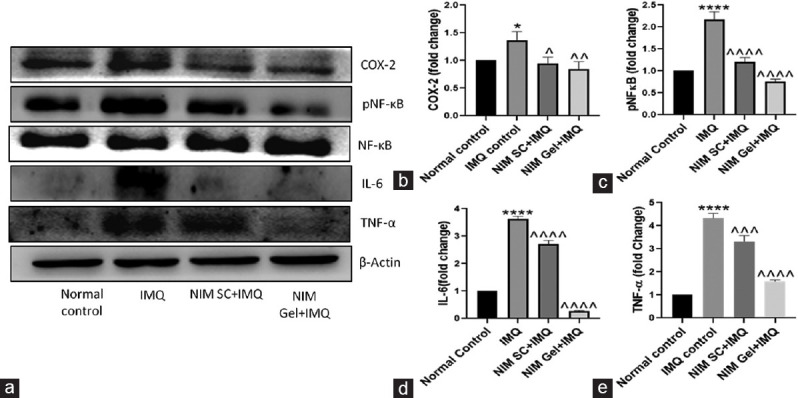
Figure 2.

Immunoblot analysis demonstrating the effect of NIM on expression of various proteins involved in inflammatory signaling cascade. (a) Representation of immunoblots of COX 2, pNF κB, NF κB, IL 6 and TNF α, (b-e) Quantification of immunoblots of COX 2, pNF κB, IL 6 and TNF α respectively. ****P < 0.0001, *P < 0.05 of IMQ versus Normal Control; ^^^^P < 0.0001, ^^^P < 0.001, ^^P < 0.01, ^P < 0.05 of NIM versus IMQ. IMQ = Imiquimod, NIM = Nimbolide, TNF = Tumor necrosis factor, IL = Interleukin
