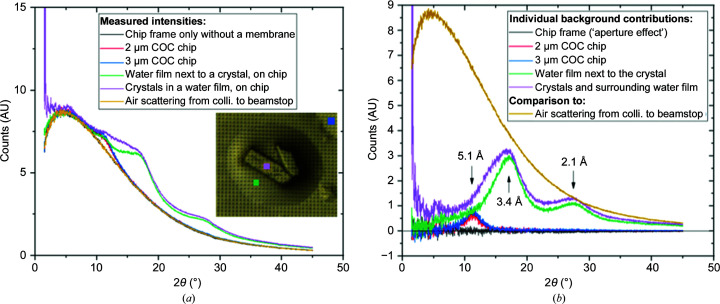
Figure 5.
(a) Total background measurements and (b) separated contributions from the different sample components. The curves in (b) were obtained by subtraction of the air scattering from the relevant curves. The inset microscope picture in (a) shows the position of the beam on the sample for the most intense background curves as squares of the same color as the respective curve. The colored squares are 10 µm in size, representing the beam size.

