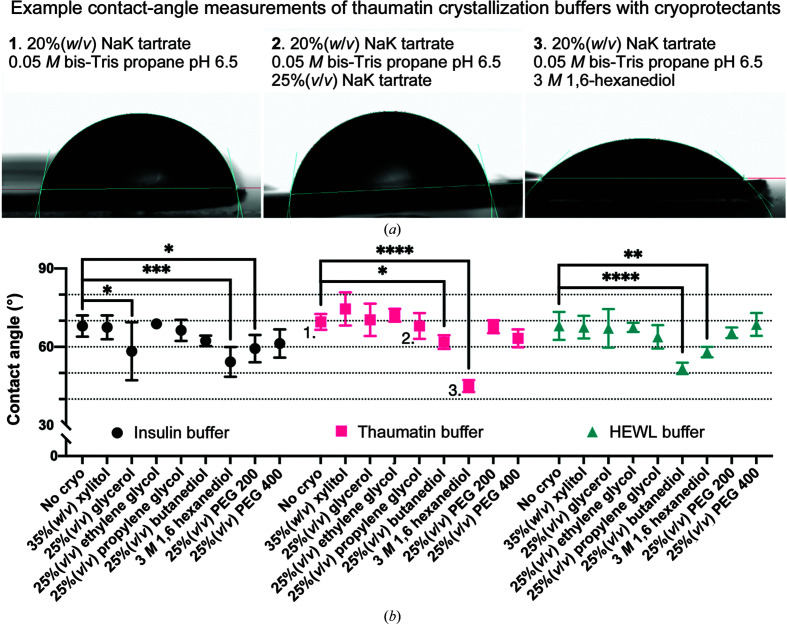
Figure 6.
An analysis of how the addition of different common cryoprotectant compounds to a series of crystallization solutions changes their chip–solution contact angle. (a) Example images of contact-angle measurements for a thaumatin crystallization buffer without (1) and with (2 and 3) different cryoprotectants. (b) A comparison of the effects that different cryoprotectants have on the chip–solution contact angle of three different protein crystallization buffers (see Table 3 ▸). The measurements corresponding to the images in (a) have been labeled. The mean and 95% confidence limits of each measurement have been plotted. The asterisks indicate the significance of the p-value obtained from a one-way ANOVA comparison between the ‘no cryo’ buffer and the buffer plus an additive (*, <0.0332; **, <0.0021; ***, <0.0002; ****, <0.0001).

