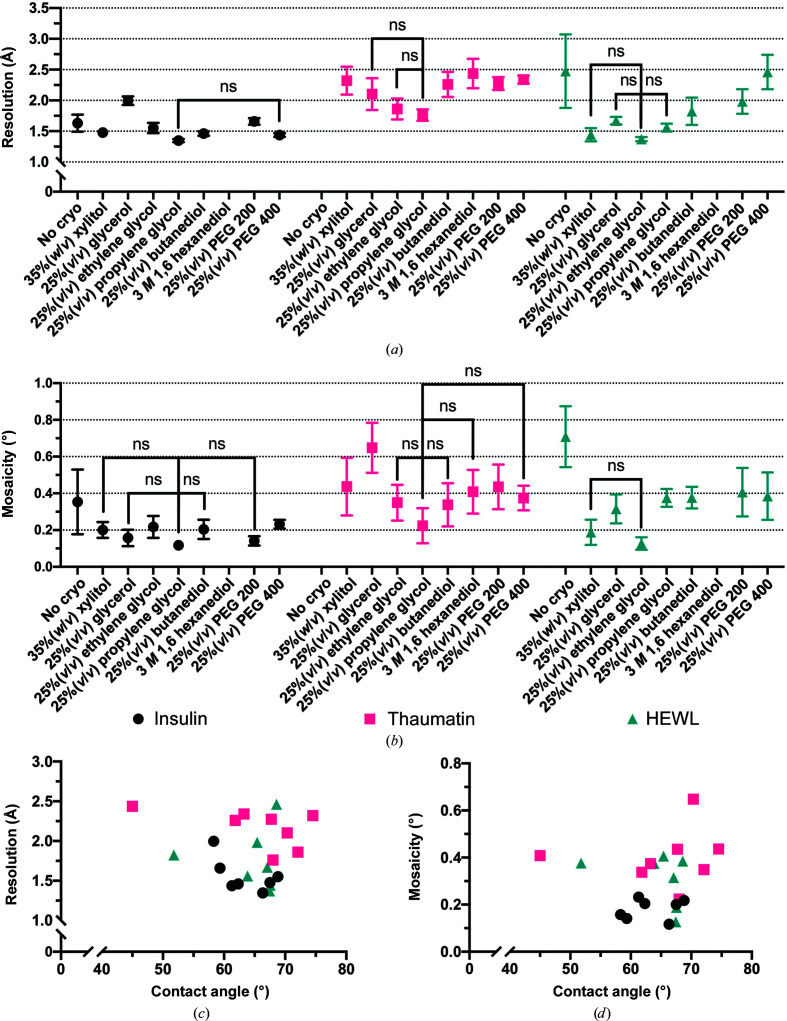
Figure 7.
Comparing the resolution (a) and mosaicity (b) of insulin, thaumatin and HEWL crystals mounted on chips with different cryoprotectants. The high-resolution limit was set at the point where CC1/2 = 0.3. The mean and 95% confidence limits of each measurement have been plotted. Data points that are not significantly different (ns), as determined by a one-way ANOVA comparison, from the highest resolution or lowest mosaicity point for each protein have been marked. (c , d) The contact angle of each cryoprotectant for each protein/buffer plotted against their resolution and mosaicity, respectively. A Pearson correlation analysis was performed for the cryoprotectants in each protein/buffer and none were found to be significantly correlated.

