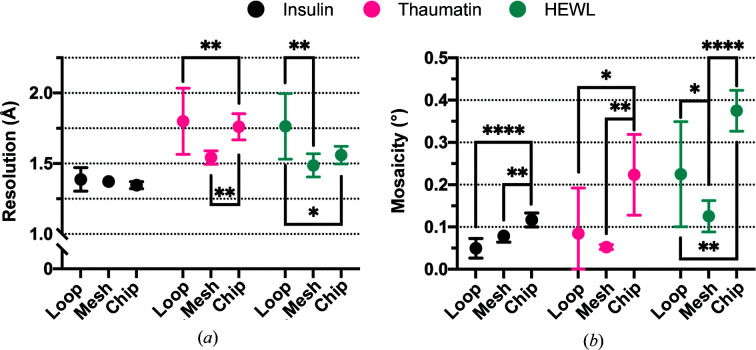
Figure 8.
A comparison of the mean resolution (a) and mosaicity (b) of diffraction data collected from crystals mounted in loops, meshes or chips. The high-resolution limit was set at the point where CC1/2 = 0.3. The mean and 95% confidence limits of each measurement have been plotted. The asterisks indicate the significance of the p-value obtained from a one-way ANOVA comparison between the different mount (*, <0.0332; **, <0.0021; ***, <0.0002; ****, <0.0001).

