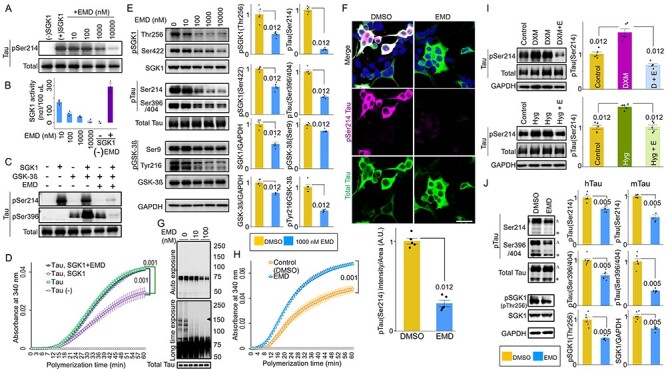
Figure 6 .

SGK1 inhibitor EMD638683 ameliorates GSK-3ß-mediated tau phosphorylation. (A, B) Dose-dependent inhibition of SGK1 by EMD638683 (EMD). Phosphorylation of tau at Ser214 by SGK1 was monitored using recombinant SGK1 and recombinant tau (A). SGK1 activity was monitored using the ADP-Glo kinase assay using recombinant tau as a substrate in the presence or absence of EMD. Results of the reaction without SGK1 are also shown [EMD (−) and SGK1 (−)]. n = 3 biological replicates (B). (C) EMD inhibits GSK-3ß kinase activity through SGK1. GSK-3ß kinase activity toward tau was evaluated using the pSer396 tau antibody. (D) EMD restores the tubulin polymerization ability of tau in the presence of SGK1. n = 4 biological replicates. (E) EMD inhibits both SGK1- and GSK-3ß-associated phosphorylation sites of tau. SH-SY5Y cells stably expressing tau were treated with the indicated concentrations of EMD for 24 h. Graphs represent quantification of the indicated proteins. n = 5 biological replicates. (F) EMD results in reduced Ser214-phospho-tau in SH-SY5Y cells stably expressing tau. Cells were treated with EMD for 24 h. Graph represents quantification of pSer214 fluorescent intensities in tau-positive areas. n = 8 images from five biological replicates. (G) EMD suppresses oligomeric tau formation (middle, arrowhead). Blots were detected using the PS396 (top and middle) and total tau (bottom) antibodies. (H) EMD improves the tubulin polymerization ability of tau. n = 5 biological replicates. (I) DXM (upper)- or high glucose (lower)-mediated pSer214 tau phosphorylation is inhibited by EMD. SH-SY5Y cells stably expressing tau were treated with 1 μm DXM or 33 mm glucose for 6 h in the presence (D + E or Hyg + E) or absence of 1 μm EMD. Graphs represent quantification of the indicated proteins. n = 5 biological replicates. (J) EMD inhibits both SGK1- and GSK-3ß-associated phosphorylation sites of tau in the hippocampi of Tg601 mice. Tg601 mice were injected stereotactically with 5.0 mg/kg of EMD in the hippocampi and sacrificed after 72 h. Graphs represent quantification of the indicated proteins. n = 6 mice. Graphs in (B, D–F, H–J) represent means ± SEM and P-values are indicated in the graphs. Mann–Whitney U test (B, D, E, H, I) and a paired Student’s t-test (F, J). Scale bar: 50 μm (F).
