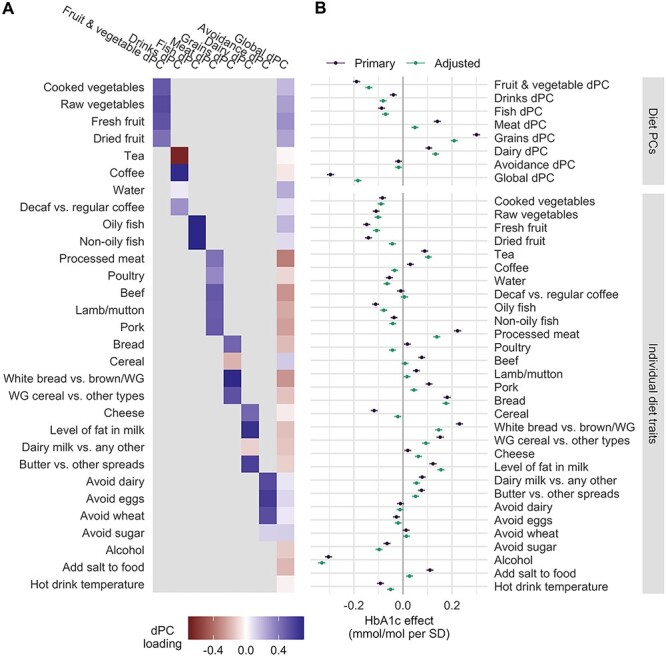
Figure 2 .

Dietary traits and associations with HbA1c. (A) Heatmap displays loadings for each of the 30 dietary traits characterizing the seven food group dPCs and one global dPC. Higher positive loadings denote higher contributions of the trait (y-axis) to the associated dPC (x-axis). (B) Forest plot of coefficients from regression of HbA1c on each dietary trait. Models included either the same set of covariates as in the primary GWIS (‘Primary’; purple) or those from sensitivity model 3 (‘Adjusted’; adjusted for birthplace, assessment center, BMI, smoking, educational attainment and physical activity; purple). Error bars correspond to 95% confidence intervals.
