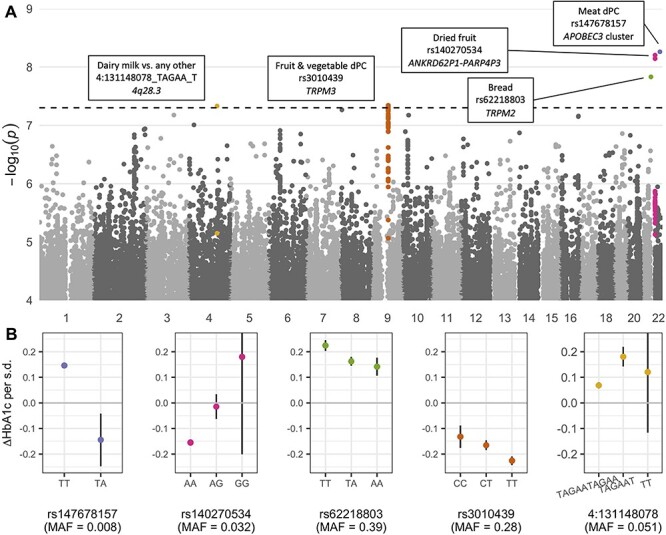
Figure 3 .

Genome-wide GDI analysis results. (A) Manhattan plot shows minimum -log10 (P-values) as a function of genomic position across all 38 GWIS. Colors correspond to independent loci with index variants having P < 5 × 10⁻⁸, and variants are assigned to a peak if within 50 kb of an index variant and having P < 1 × 10⁻⁵. Index variants are annotated with the trait, variant rsID (where available), and annotated gene. (B) Dietary effect sizes on HbA1c (change in HbA1c associated with a standard deviation increase in the associated dietary trait; y-axis) after stratification by genotype (closest genotype based on dosages; x-axis), using the primary analysis covariates. Points and bars denote stratified main effect estimates and 95% confidence intervals from the primary model. Genotype-stratified effects are shown only for genotype groups containing >100 individuals. Effect estimates are in terms of mmol/mol HbA1c. s.d.: standard deviation.
