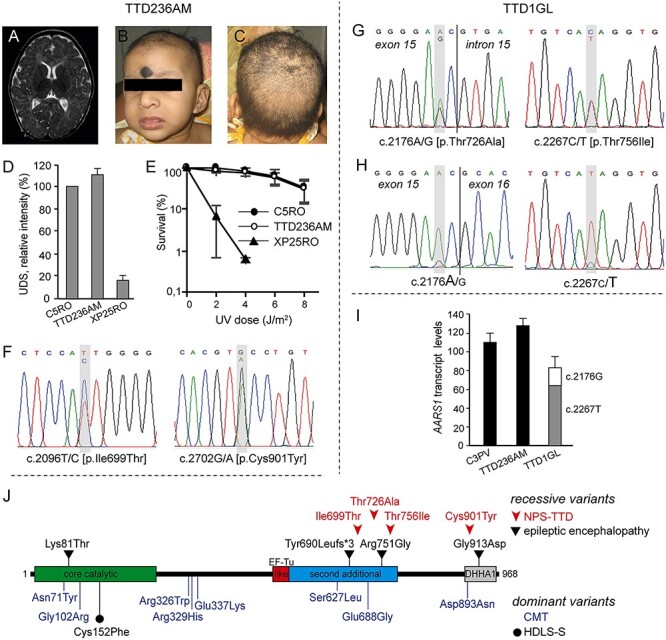
Figure 1 .

AARS1-defective NPS-TTD cases. (A–C) Clinical features of TTD236AM. MRI of the brain showing delayed myelination (A); frontal face appearance (B); view of the scalp with sparse hair (C) and (D) DNA repair capacity in control (C5RO), TTD236AM and NER-deficient xeroderma pigmentosum group A (XP-A; XP25RO) primary fibroblasts. DNA repair capacity was measured as UV-induced DNA repair synthesis (UDS), using EdU incorporation after UV irradiation and visualization by fluorescence-conjugated azide (Click-iT assay). Mean fluorescence intensities of at least 50 nuclei were expressed as percentage of those of control cells analyzed in parallel. Bars indicate standard deviation (SD) of three independent experiments. (E) Clonogenic UV-survival assay to measure UV sensitivity in C5RO (closed circles), TTD236AM (open circles) and XP25RO (closed triangles) primary fibroblasts. One day after seeding, fibroblasts were irradiated with different doses of UV and cultured for 2 weeks. Survival was plotted as the percentage of colonies obtained after treatment compared with the mock-treated fibroblasts (set at 100%). Bars indicate SD of three independent experiments. (F) Sanger sequencing traces of TTD236AM AARS1 genomic DNA. TTD236AM shows compound heterozygosity for c.2096C > T and c.2702G > A. (G, H) Sanger sequencing traces of TTD1GL AARS1 genomic DNA (G) and cDNA (H). TTD1GL shows compound heterozygosity for c.2176A > G and c.2267C > T (G) and reduced expression of the c.2176A > G carrying AARS1 allele (H). (I) Cellular levels of AARS1 transcripts assessed by RT-qPCR. Total AARS1 transcript levels were first normalized to the levels of GAPDH mRNA and then expressed as percentages of the corresponding value in the normal C3PV cells. The relative percentage of the mutant AARS1 transcripts in TTD1GL cells (c.2176A > G and c.2267C > T) was assessed by allele-specific RT-qPCR. The reported values are the means of two independent experiments, each done in triplicate. Bars indicate SD. (J) Schematic representation of the domain structure of the AlaRS protein and location of the identified variants. Recessive and dominant variants are shown over and under the protein scheme, respectively. EF-Tu-like, elongation factor Tu-like; DHHA1, desert hedgehog homolog-associated domain.
