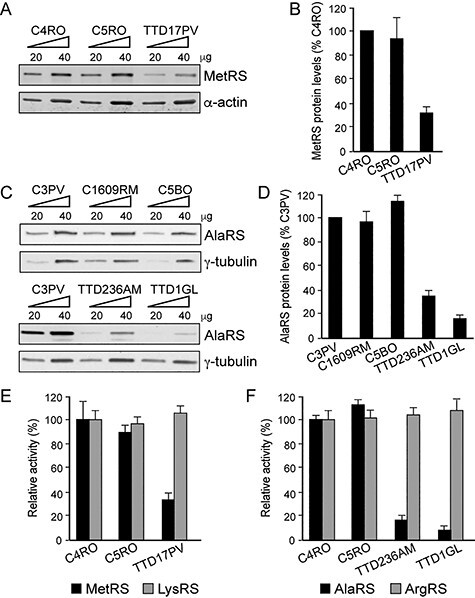
Figure 3 .

MetRS or AlaRS protein levels and aminoacylation activity in primary fibroblasts from TTD17PV, TTD236AM and TTD1GL. (A) Immunoblot of whole-cell lysates from TTD17PV and two healthy donors (C4RO and C5RO) probed with anti-MetRS antibody. α-actin was used as loading control. (B) Quantification of MetRS protein levels. The amount of MetRS was first expressed as the mean value of the levels observed in the two increasing concentrations of the cell lysate and was normalized to the α-actin content. For each cell strain, the MetRS level was then expressed as percentage of the corresponding value in C4RO cells. The reported values are the means of two independent experiments. Bars indicate SD. (C) Immunoblot of whole-cell lysates from TTD236AM, TTD1GL and three healthy donors (C3PV, C1609RM and C5BO) probed with anti-AlaRS antibody. γ-tubulin was used as loading control. (D) Quantification of AlaRS protein levels carried out as in (B). The AlaRS amount was normalized to γ-tubulin. For each cell strain, the AlaRS level was expressed as percentage of the corresponding value in C3PV cells. The reported values are the means of two independent experiments. Bars indicate SD. (E, F) Cytosolic fractions from TTD17PV, TTD236AM and TTD1GL and two healthy donor fibroblasts (C4RO and C5RO) were used to determine MetRS (E) or AlaRS (F) amino acid charging on tRNA. LysRS (E) or ArgRS (F) charging in control fibroblast C4RO was set at 100%, and error bars indicate SD of three independent experiments.
