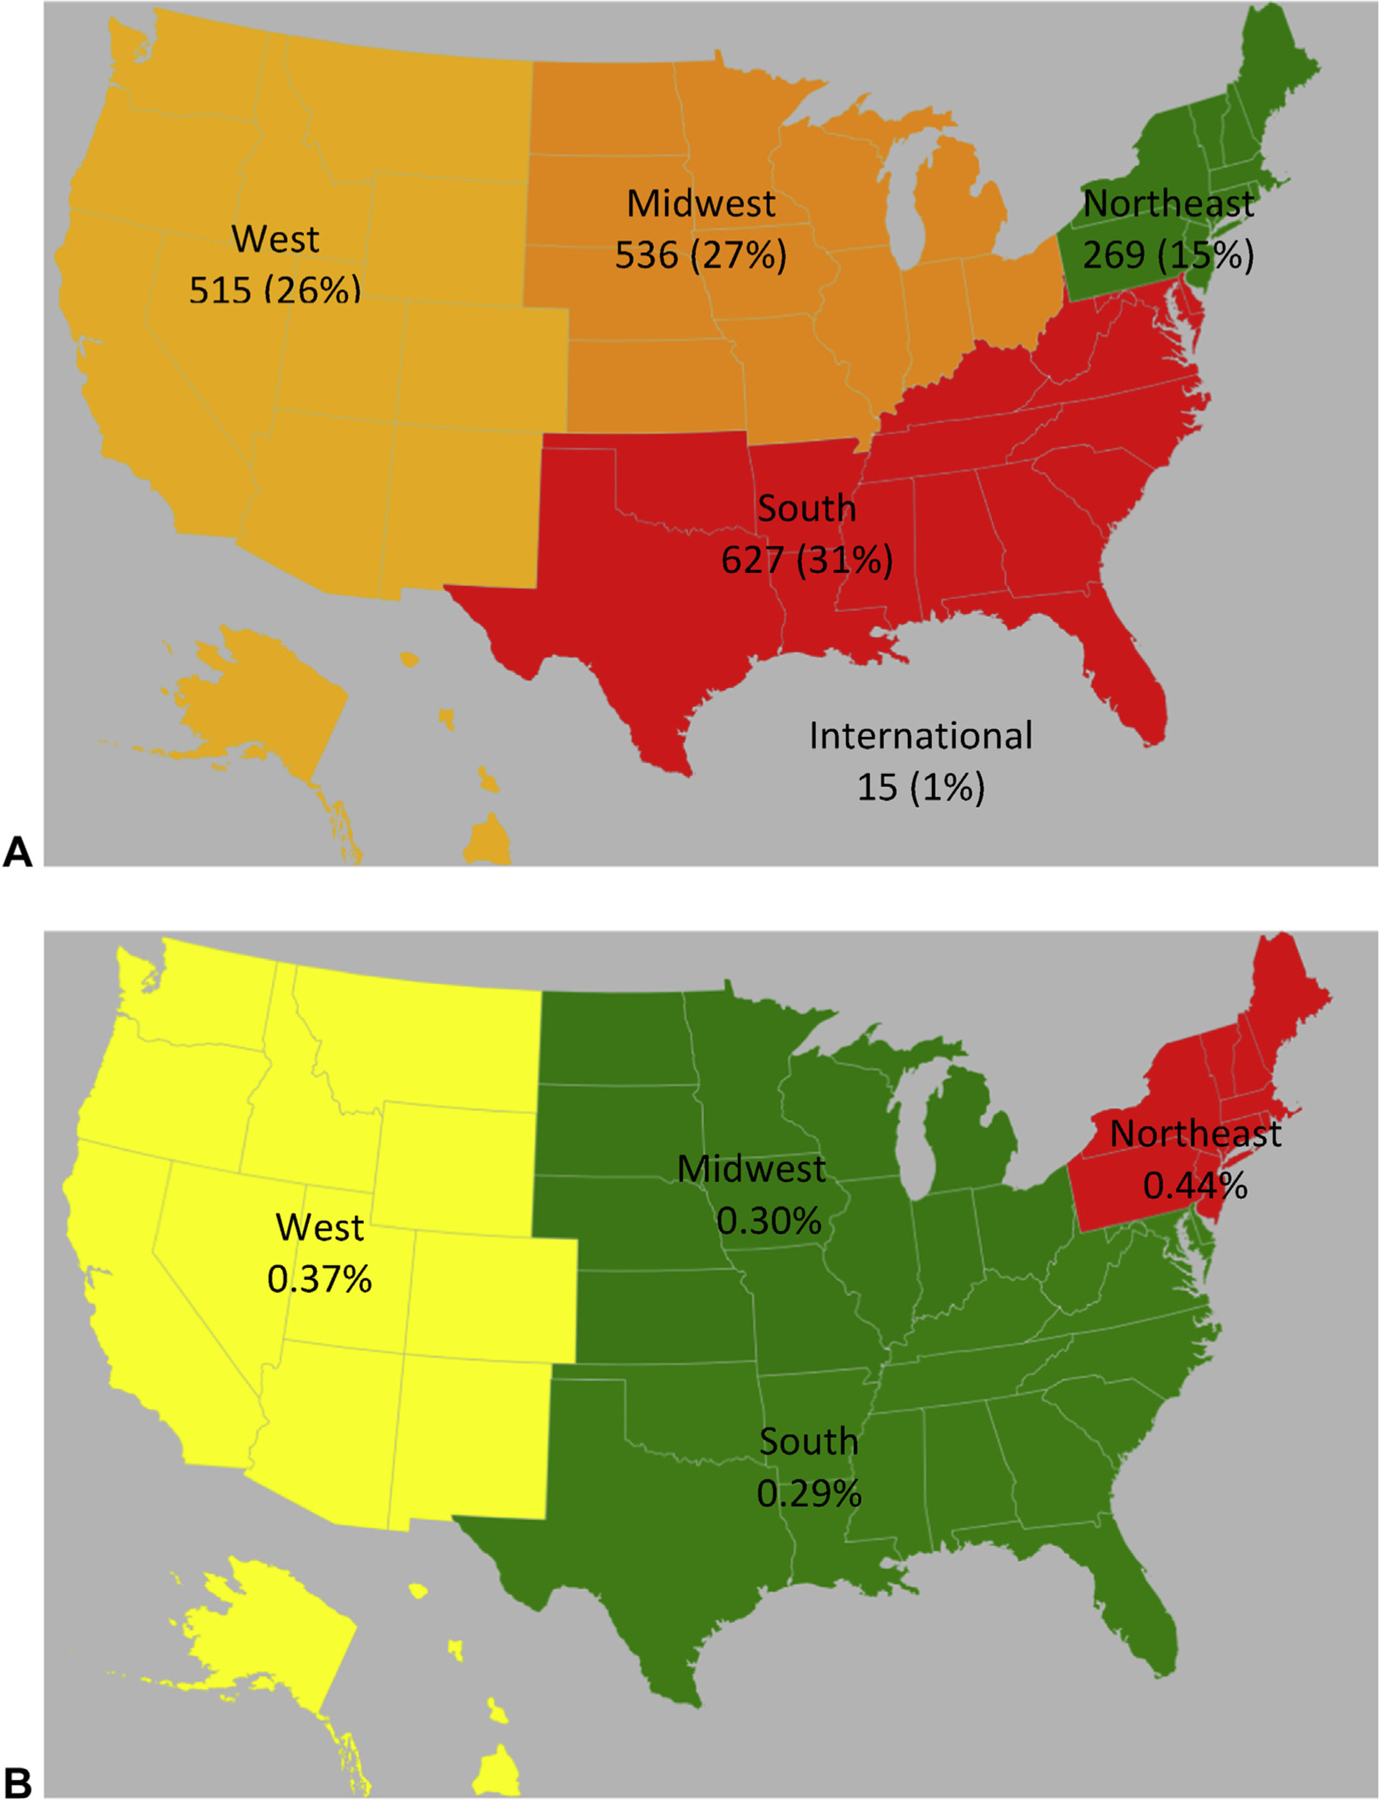
FIGURE 1.

Prevalence according to US census region. Census regions are depicted on these maps. Regions are colored using a heat map with red>green. A, Absolute PICU anaphylaxis cases. B, Relative PICU anaphylaxis in comparison to total PICU admissions in the VPS database during this time frame, which were distributed as follows: West, 139,469 (23%); Midwest, 181,460 (30%); South, 214,542 (35%); Northeast, 66,563 (11%); International, 4,234 (0.7%).
