Figure 1.

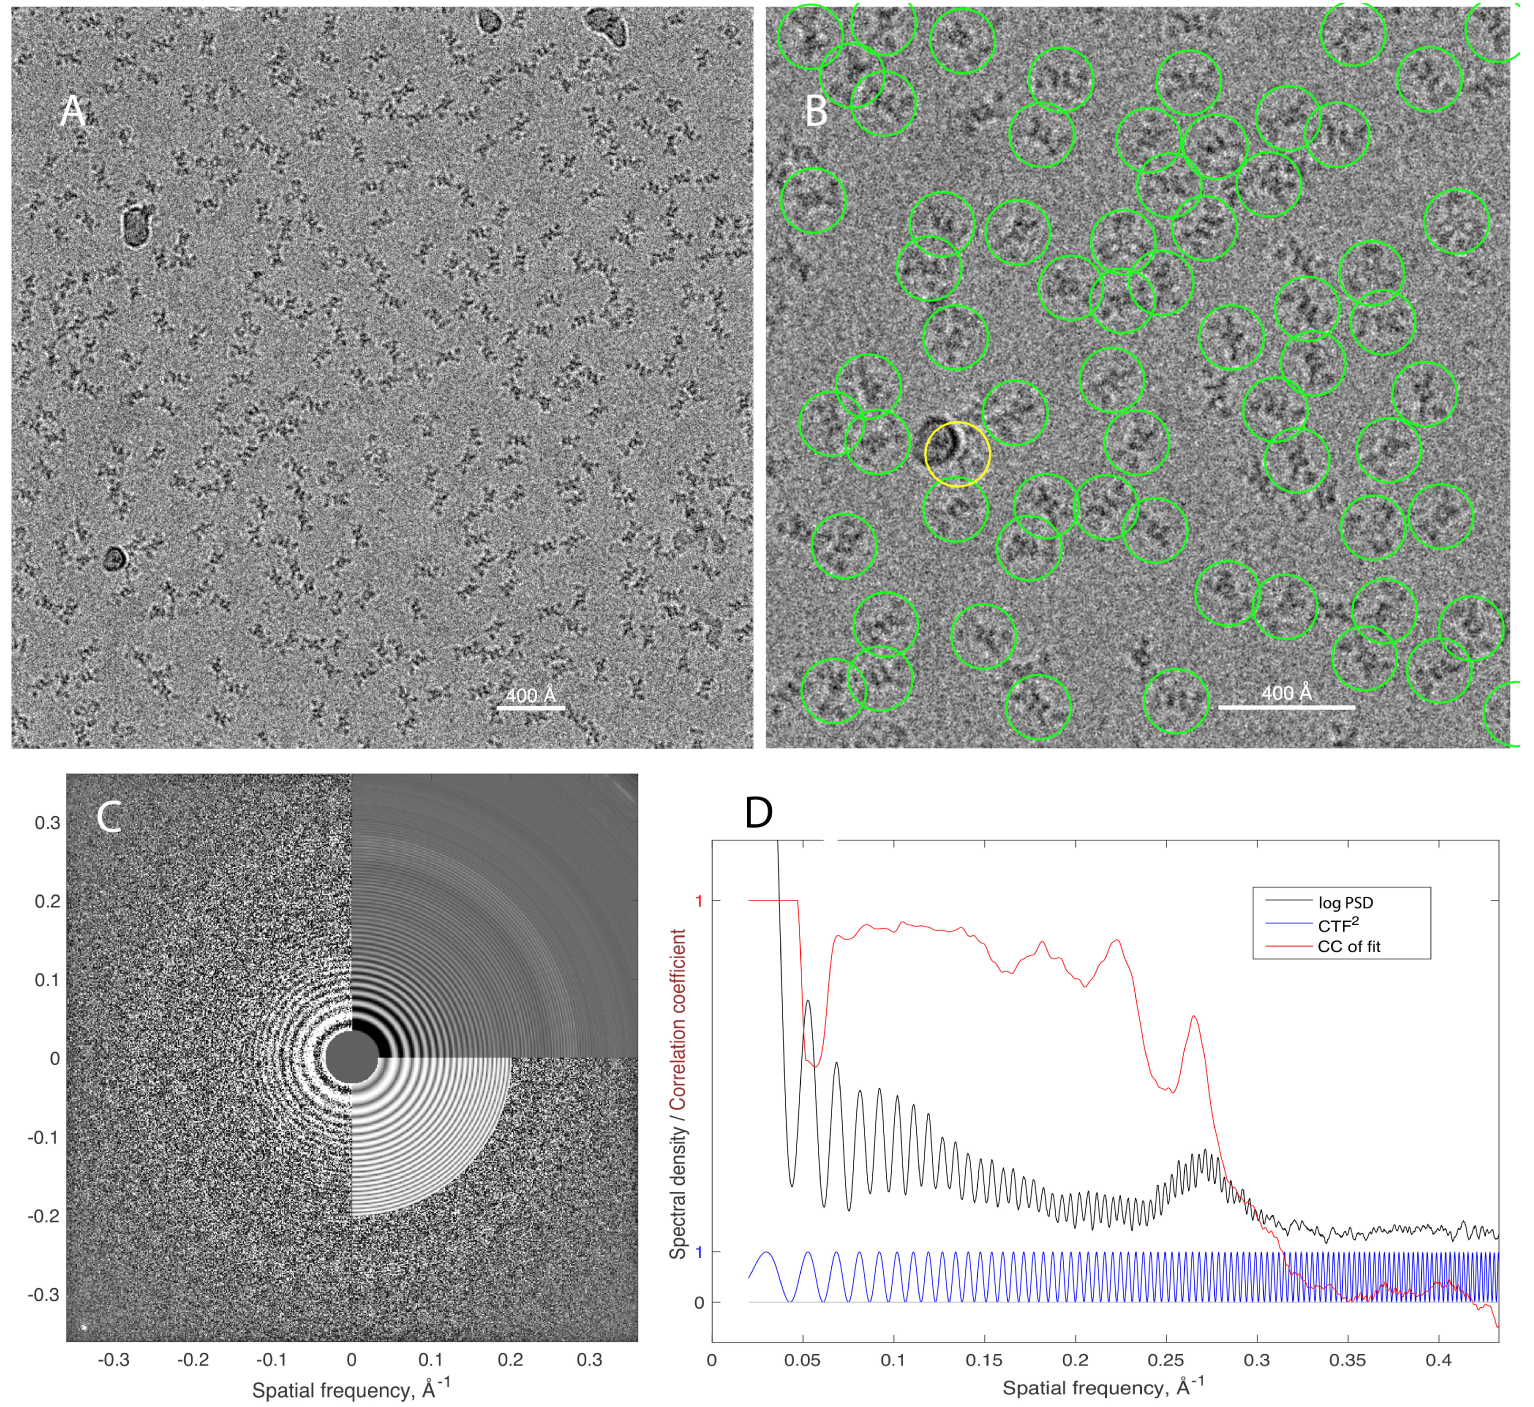
A cryo-EM micrograph of PaaZ protein particles. A, the entire micrograph, depicting a specimen area of 434 × 434 nm with a pixel size of 1.06Å. The field contains about 220 PaaZ particles along with a few contaminating “ice balls”. The image was obtained on a Titan Krios microscope at 300kV, and is displayed after low-pass filtering for clarity. B, a close-up of the micrograph with particles, selected automatically by template-matching, indicated by circles. One particle image selected in error (yellow circle) has an ice ball superimposed. C, Fit of the CTF to the 2D power spectrum of the micrograph. The left half of the image shows the experimental power spectrum of the micrograph; the upper right quadrant shows the circularly-averaged power spectrum; the lower right quadrant shows the fitted CTF2(|k|). The fitted parameters included defocus = 2.66μm and astigmatism 49 nm. The bright spot in the lower-left corner comes from a 2.1Å periodicity of the underlying crystalline graphene oxide substrate. D, a 1D representation of the power spectrum (black curve), obtained, after rough prewhitening, by approximately-circular averaging that takes into account astigmatism. Also shown is the theoretical contrast-transfer function H2 (Eq. 7; blue curve) and a plot of the cycle-by-cycle correlation coefficient between the two (red curve) showing that information is present for spatial frequencies |k| ≲ 0.3Å−1. The broad peak near |k| = 0.27Å−1 comes from the amorphous ice itself; although not in a crystal lattice, water molecules have correlated positions with a nearest-neighbor distance of about 3.7Å. Experimental data in this and subsequent figures are from (6).
