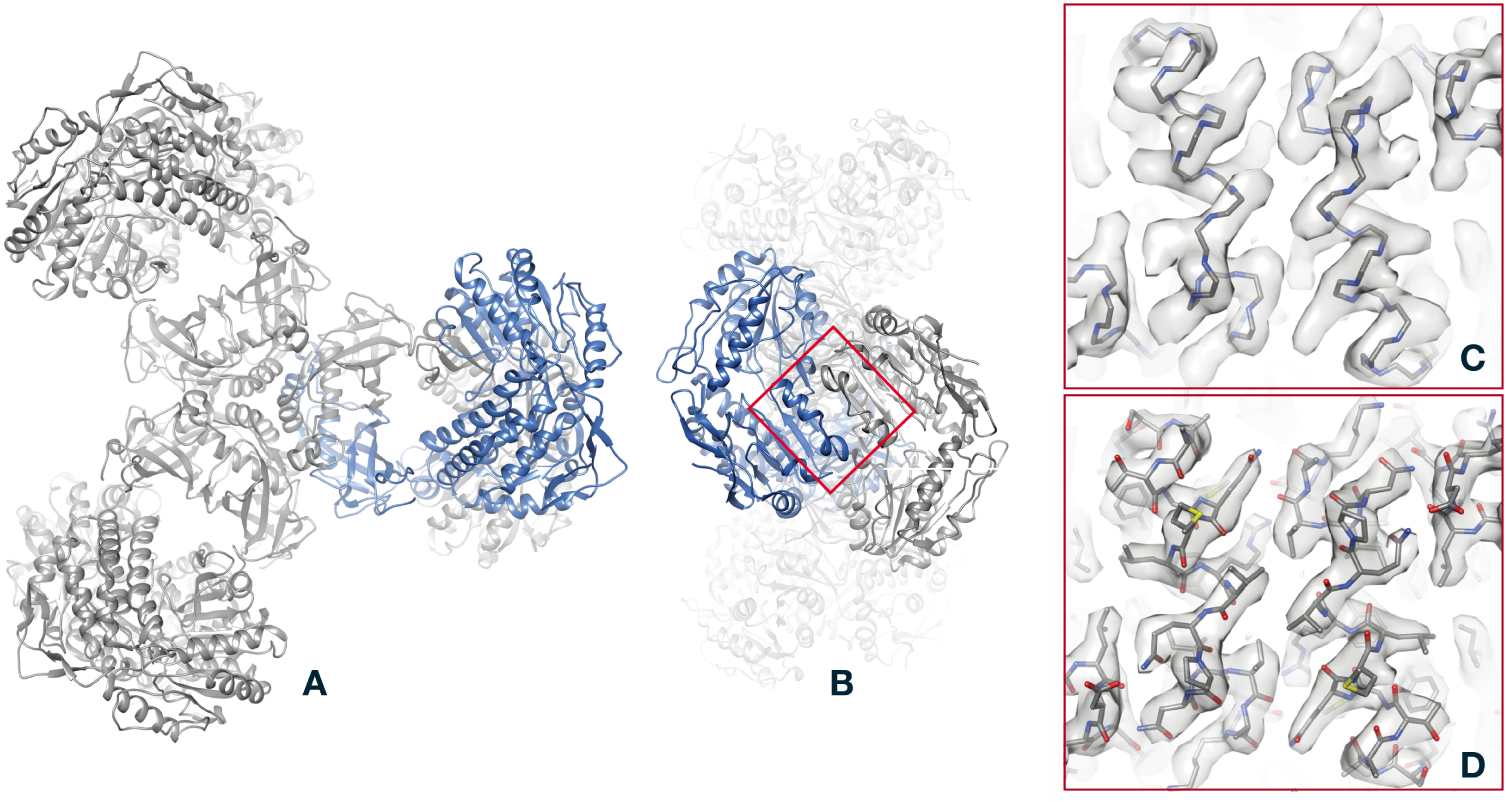
Figure 4.

The last step in structure determination: fit of an atomic model to the PaaZ reconstruction. A, overview of the PaaZ model, with ribbons denoting the folding of the polypeptide chain. To give an idea of the physical scale of the model, the helical structures (alpha helices) have a pitch of 5.4Å. One of the six identical subunits in the PaaZ macromolecule is colored blue. B, an “end” view of the model, obtained by a 90° rotation. C, superposition of the polypeptide backbone on the density map (gray surface rendering), shown for the region of two alpha helices marked by the red square in B. D, comparison of the map and model, this time with all non-hydrogen atoms shown. Although individual atoms are not resolved in the 2.9Å map, bulges in the helical features of the map constrain the angles of flexible bonds in the amino-acid side chains, so that atom positions are well determined.
