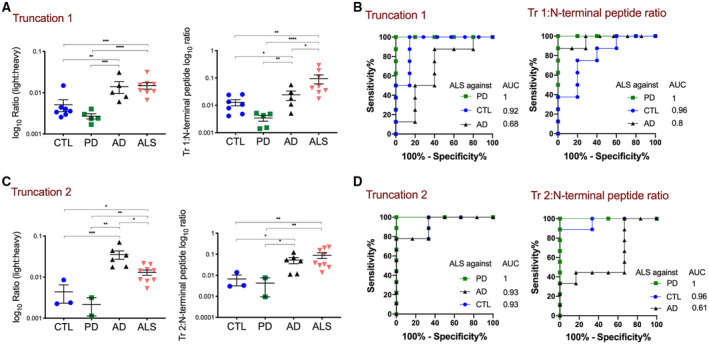
FIGURE 3.

Quantification of truncation site‐specific TDP‐43 peptides by MS‐PRM identifies pathological TDP‐43 processing in motor and prefrontal cortex urea fractions of ALS and AD. (A) and (C) Shown are absolute abundances of light peptides (log10 ratio (light:heavy peptide)) (A) The Truncation 1 peptide was increased in ALS (n = 16) compared to PD (n = 8) and CTL (n = 8) (****p < 0.0001, ***p = 0.0008), but not in ALS compared to AD (n = 8) (p = 0.94). Truncation 1 was increased in AD compared to PD and CTL (p = 0.0004 and 0.007). The Truncation 1: N‐terminal peptide ratio was increased in ALS compared to AD, PD, and CTL (*p = 0.04, ****p < 0.0001 and p = 0.001). One‐way ANOVA with Dunnett’s multiple comparison test. (B) ROC curves of the Truncation 1 abundance and the calculated Truncation 1: N‐terminal peptide ratio for discrimination between ALS and CTL, PD or AD. For comparison, the AUCs are shown. (C) The Truncation 2 peptide was increased in ALS compared to PD and CTL (**p < 0.002, *p = 0.01), but decreased compared to AD (*p = 0.01). Truncation 2 was also increased in AD compared to PD and CTL (p < 0.0001 and p = 0.0001). The Truncation 2: N‐terminal peptide ratio was increased in ALS compared to PD and CTL (**p = 0.004, **p = 0.007), but not AD (p = 0.79). One‐way ANOVA with Dunnett’s multiple comparison test. (D) ROC curves of the Truncation 2 abundance and the calculated Truncation 2: N‐terminal peptide ratio for discrimination between ALS and CTL, PD or AD. For comparison, the AUCs are shown
