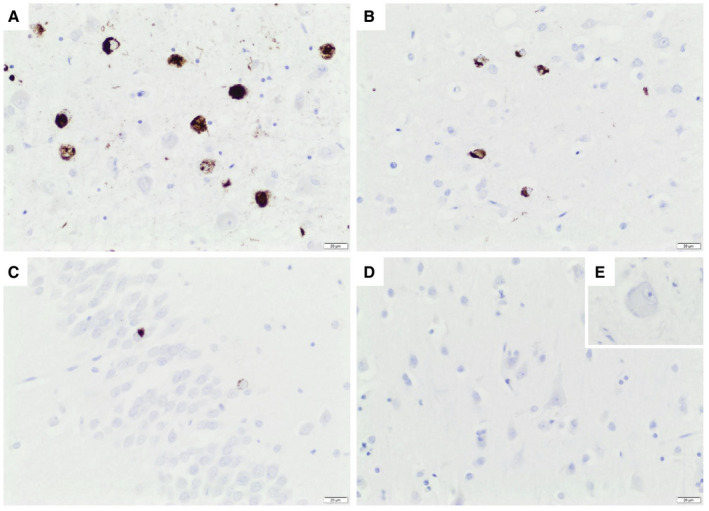
FIGURE 5.

Coexisting LATE neuropathological change in AD brain. Depicted is an AD case with the highest PRM values for Truncation 1 and 2. pTDP‐43 aggregates in (A) amygdala, (B) entorhinal cortex, and (C) hippocampal granule cells according to LATE‐NC Stage 2. No pTDP‐43 aggregates were visible in primary motor cortex (D) and hypoglossal nucleus (E, inset). Scale bar 20 µm
