Abstract
Glioblastomas (GBMs) are highly aggressive, recurrent, and lethal brain tumors that are maintained via brain tumor‐initiating cells (BTICs). The aggressiveness of BTICs may be dependent on the extracellular matrix (ECM) molecules that are highly enriched within the GBM microenvironment. Here, we investigated the expression of ECM molecules in GBM patients by mining the transcriptomic databases and also staining human GBM specimens. RNA levels for fibronectin, brevican, versican, heparan sulfate proteoglycan 2 (HSPG2), and several laminins were high in GBMs compared to normal brain, and this was corroborated by immunohistochemistry. While fibrinogen transcript was at normal level in GBM, its protein immunoreactivity was prominent within GBM tissues. These ECM molecules in tumor specimens were in proximity to, and surrounding BTICs. In culture, fibronectin and pan‐laminin induced the adhesion of BTICs onto the plastic substratum. However, fibrinogen increased the size of the BTIC spheres by facilitating the adhesive property, motility, and invasiveness of BTICs. These features of elevated invasiveness were corroborated in resected GBM specimens by the close proximity of fibrinogen with matrix metalloproteinase (MMP)‐2 and‐9, which are proteases implicated in metastasis. Moreover, the effect of fibrinogen‐induced invasiveness was attenuated in BTICs where MMP‐2 and ‐9 have been inhibited with siRNAs or pharmacological inhibitors. Our results implicate fibrinogen in GBM as a mediator of the invasive properties of BTICs, and as a target for therapy to reduce BTIC tumorigenecity.
Keywords: ECM, extracellular matrix, fibrinogen, glioblastoma, glioma stem cell, invasiveness
We implicate fibrinogen in glioblastoma as a mediator of the invasive properties of brain tumour initiating cells, and as a target for therapy to reduce tumorigenecity
1. INTRODUCTION
Glioblastoma (GBM) is the most common and fatal of adult primary malignant brain tumors (1). Despite aggressive therapies, the median survival is 21 months and less than 5% of patients survive to 5 years (2, 3, 4). One reason for this poor prognosis is the presence of brain tumor‐initiating cells (BTICs) within the GBM microenvironment (5). BTICs are more chemo‐ and radio‐ therapy resistant than their further differentiated counterparts (6, 7, 8). BTICs not only drive tumor growth, and tumor recurrence after multimodal therapy, they also contribute to the infiltrative nature of GBM (9, 10, 11, 12). BTICs exhibit stem cell‐like properties, such as self‐renewal capacity and expression of stemness markers (13, 14, 15).
Increasing evidence suggests that the extracellular matrix (ECM) serves as a niche for BTICs in the tumor microenvironment (16, 17). The ECM is comprised of a dense network of glycans and proteins that are synthesized intracellularly and secreted into the brain parenchyma (18). ECM molecules include chondroitin sulfate proteoglycans (CSPGs), heparan sulfate proteoglycans (HSPGs), collagens, tenascin‐C, laminin, fibronectin, and Fibrinogen (19, 20, 21). There are four types of lectican CSPGs in the CNS: brevican, neurocan, aggrecan, and versican. These ECM components create a structural and biological milieu that regulate self‐renewal, proliferation, and differentiation of BTICs (22, 23).
The aggressive GBM phenotype is highly dependent on the proportion and properties of ECM components within the tumor microenvironment (24, 25, 26). For example, fibronectin and laminin are ECM proteins that are overexpressed in GBMs with an invasive phenotype (27, 28). These proteins promote adhesion and migration of GBM cell through their interactions with other ECM molecules (27, 28, 29). GBM growth, invasion, and adhesion are also enhanced through the modification of CSPG and HSPG glycosaminoglycan and sulfation patterns (30, 31, 32).
Despite these findings, the relative importance and proportion of the ECM components within human GBM microenvironment and their supportive functions for BTIC growth have yet to be determined. We hypothesized that different ECM molecules would vary in the extent to which they assist BTIC growth. To test this, we first identified candidate ECM molecules for in vitro experimentation by using The Cancer Genome Atlas (TCGA) and Genome Tissue Expression (GTEx) databases and staining a number of human GBM specimens. We then analyzed and compared the effects of these ECM molecules on patient‐derived BTICs in vitro.
2. MATERIALS AND METHODS
2.1. Hierarchical clustering analysis of extracellular matrix genes in GBM and normal brain cortex tissue
RNA sequencing data for primary GBM specimens and normal brain tissue samples from TCGA and GTEx project, respectively, were downloaded using the TCGAbiolinks Bioconductor package (33). To mitigate database‐specific differences, datasets were harmonized using the Recount2 pipeline (34). Data for 157 GBM and 252 normal brain samples from the cortex and frontal cortex (BA9) were retrieved. Ensemble gene identifiers were converted into HUGO gene symbols using the biomaRt Bioconductor package (35). Raw counts were normalized to transcripts per million (TPM) based on gene length prior to hierarchical clustering analysis with the pheatmap R package.
2.2. Differential expression analysis of GBM and normal brain cortex tissue
Raw counts for primary GBM and normal tissue specimens were downloaded as described above. Gene expression values were normalized based on GC Content and genes with low expression were detected and removed based on a quantile cut‐off. Normalized counts were utilized for a differential expression analysis with the limma‐voom pipeline (36, 37). Log20‐fold changes were converted into absolute fold changes, and genes with absolute fold changes of less than 1.5 were filtered out.
2.3. Immunofluorescence staining of tissues
Human glioblastoma tissues were collected in accordance with the protocols approved by the Indiana University Institutional Review Board. The fresh tissues surgically removed from patients were snapped frozen and stored in −80°C. The tissues were fixed in formalin and histologically processed for paraffin‐embedded blocks for the studies. The hematoxylin and eosin stained slides were examined by a neuropathologist (CH). Tissues were sectioned (6 µm) and deparaffinized as previously described (38). Normal brain tissues were obtained from non‐transformed control samples as described somewhere (11). Following antigen retrieval and blocking in 1% BSA, the slides were stained with primary antibodies overnight at 4°C. The following primary antibodies were used for their respective targets: fibrinogen (Abcam, ab34269, 1:200), fibronectin (Abcam, ab23750, 1:200), brevican (Thermo Fischer, pa‐31444, 1:500), versican (EMD Millipore, ab1032, 1:200), HSPG2 (EMD Millipore, Mab1948p, 1:100), laminin α‐3 (US Biological, 344125, 1:200), SOX2 (Abcam, ab171380, 1:200), MMP‐2 (Abcam, ab86607, 1:500), and MMP‐9 (Abcam, ab236494, 1:500). For intracellular staining of markers including laminin alpha‐3 and SOX2, cells were permeabilized with 0.2% Triton X‐100 before probing with the primary antibody. The slides were then washed, incubated with fluorescent‐conjugated secondary antibodies for 60 min, washed, and then mounted using DAPI Fluoromount‐G (SouthernBiotech) mounting medium. Fluorescence imaging was done using the Leica TCS SP8 confocal laser scanning microscope.
To generate 3D reconstructions, the Z‐stacks from the confocal images were loaded into the Imaris software (Bitplane, version 9.2.0) and adjusted for background staining. Surfaces for each fluorophore were then created and adjusted to generate a 3D representation of the staining. These surfaces were then compiled to obtain a visualization of the cellular interactions with the ECM molecules.
Intensity analysis of the immunofluorescence glioblastoma (n = 5) and normal human brain (n = 2) tissue staining was conducted using ImageJ; multiple images were taken per tissue section (glioblastoma n = 3, normal brain n = 2) for analysis. Each image Z stack was compiled into a Z project at a projection type of maximum intensity in ImageJ. The minimum and maximum intensities of the ECM molecule staining, excluding the DAPI staining, were adjusted to the approximate beginning and end of the signal spike, respectively. To determine the positive signal, the color brightness threshold was set consistently using a value determined by the negative secondary antibody‐stained control. The mean gray value of the images was taken and the mean fluorescence intensity (MFI) for each patient was analyzed in GraphPad Prism 9.0.0.
2.4. Culture of patient‐derived BTICs in the presence of ECM molecules
BTICs lines (BT048, BT073, and BT100) were obtained from surgical resections of GBMs from the Brain Tumor Bank of the University of Calgary as previously described (39). The lines were checked for stemness markers (musashi 1, nestin, and CD90), self‐renewal property to reform spheres (Figure S1), and genetic identity routinely. All experiments with human cells or resected brain specimens were conducted with approval from the Conjoint Health Research Ethics Board, University of Calgary, with informed consent from the human subjects.
To propagate the lines, BTICs were dissociated and plated in T‐25 flasks at regular intervals and grown in 5% CO2 as described elsewhere (39, 40). Briefly, for culturing patient‐derived BTICs, NeuroCult™ NS‐A Basal Medium (referred to here as BTIC medium) was used. This medium was supplemented with NeuroCult Proliferation Supplement (Stemcell Technologies), 20 ng/ml recombinant human FGF basic protein (R&D Systems), 20 ng/ml recombinant human EGF (Peprotech), and 0.2% Heparin Solution (Stemcell Technologies). For passaging, cells were collected and centrifuged (5 min, 1200 rpm). For preparation of single cell suspension, BTICs were collected, centrifuged, and resuspended in 500 µL of Accumax (Innovative Cell Technologies). The cells were then filtered through a 40 µm cell strainer to remove any remaining spheres. Single cells were mixed with Trypan Blue (1:1) and counted using a hemocytometer. To investigate the effects of ECM molecules on BTIC growth, recombinant ECM proteins were added to a 96‐well flat‐bottom plate in specific concentrations (5, 10, and 20 µg/ml). After 3 h incubation in a Steri‐Cycle CO2 Incubator (37°C, 5% CO2), the plate was washed with PBS. Then, the single‐cell suspension of BTICs was added to the plate at 10,000 cells per well in 100 µL BTIC medium. Control cells were seeded into a well that was not protein coated. The seeded plates were then incubated in a Steri‐Cycle CO2 Incubator (37°C, 5% CO2) for 48‐72 hours. The following recombinant ECM proteins were used in this study: Fibrinogen (EMD Millipore, 341576), fibronectin (Sigma Aldrich, F4759), and laminin (EMD Millipore, CC095).
2.5. Generation of human fetal neural stem cells
Human and mouse fetal neural stem cells were generated and cultured as previously described (41). Human brain tissues were obtained from 12‐ to 18‐week‐old fetuses from therapeutic abortions according to ethical guidelines established by the University of Calgary. The use of these human samples is approved by the Institutional Review Board of the University of Calgary and consent was obtained from all donors of tissues.
2.6. Evaluation of BTIC growth
Following 48 h treatment with ECM proteins, the wells were assessed for their sphere number (38, 39). Briefly, images of the spheres were taken in multiple fields per well using a bright‐field microscope with a 10x objective. The average number of spheres above the 60‐µm‐diameter cut‐off per well was assessed by manual sphere counting. The average length of the spheres was measured manually using ImageJ. Where total cell number was shown, BTICs were collected, centrifuged, resuspended in 25 µL of Accumax, and incubated for 5 min to dissociate the spheres. Then, single cells were mixed with Trypan Blue (1:1) and counted using a hemocytometer.
2.7. Luminescent cell viability assay
A CellTiter‐Glo Luminescent Cell Viability Assay kit (Promega) was used to determine the level of ATP production. The CellTiter‐Glo Buffer was added to the cell suspension in the 96‐well plate (100 μl/well). After 10 min of incubation at room temperature, 100 µL of the solution was transferred to a white 96‐well plate and the luminescence signal was measured using a luminometer (Labsystems).
2.8. Immunofluorescence staining of cells in culture
Following incubation of BTICs with different ECM molecules, cells were fixed by adding 100 μl of 8% paraformaldehyde (PFA) to the 100 μl/well of culture medium. This was followed by incubation in a fume hood for 20 min. The PFA was then aspirated and the wells washed with PBS. The cells were then permeabilized with 0.25% Triton X‐100. After blocking with Odyssey® Blocking Buffer (Licor) for 1 h at room temperature, SOX2 primary antibody (Thermo Fisher, 14‐9811‐82, 1:200) or Musashi1 (Thermo Fisher, 14‐9896‐82, 1:500) was added to the cells and incubated overnight at 4°C. After washing, cells were incubated with secondary antibodies conjugated with fluorochromes (1:500) for 1 h at room temperature. The cells were stored in PBS at 4°C until imaging with the ImageXpress Micro XLS Widefield High‐Content Analysis System (Molecular Devices). Nuclear yellow was used to stain cell nuclei.
2.9. Extreme limiting dilution assay (ELDA)
The extreme limiting dilution assays were performed as previously described (39, 40). Briefly, BTIC cells were seeded in decreasing numbers from 200 cells/well to 1 cell/well in 200 μl BTIC medium in a round bottom 96‐well plate. Plate was incubated for 14 days, and then the number of wells containing spheres (number of positive cultures) was recorded, calculated, and plotted using online ELDA analysis program (http://bioinf.wehi.edu.au/software/elda).
2.10. Flow cytometry
Human BTICs after 2 days in culture were collected and resuspended in PBS. Upon mechanical dissociation of spheres, the suspension of single cells was incubated with an antibody against Fibrinogen (EMD Millipore, 341576). Following 20 min incubation at 4°C and washing with PBS, the cells were incubated with secondary antibody conjugated with Alexa Fluor 488 for 20 min. For flow cytometric analysis of BTIC makers, cells were treated with the following antibodies: PE anti‐Nestin (BD 561230) and APC‐Cy7 anti‐CD90 (Biolegend 328132) antibodies. Cells were then analyzed by Attune Acoustic Focusing Flow Cytometer (Thermo Fisher), gated, and quantified using FlowJo (version 10.0.7) software.
2.11. Invasion assay
Predesigned small‐interfering RNAs (siRNA; each 25 oligonucletides in length; Invitrogen) were used to target human MMP‐2 or MMP‐9 and knock down was performed as described before (42). To measure the invasion of BTICs upon treatment with ECM molecules, Transwell migration chambers (Costar 3422, polycarbonate membrane, 24‐well format, 8‐μm pore size, Corning, Inc., Corning, NY) were used as previously described (11). Briefly, one million of BTICs (BT073, BT048) or GBM cell lines (U87 and U251) were suspended in 500 μl of collagen I gel supplemented with or without fibrinogen (20 μg/ml). In some experiments, the collagen gel was supplemented with metalloproteinase inhibitors BB94 (500 nM; British Biotech) or GM6001 (10 μM; Calbiochem). Inhibitors were added to the gel 1 h before addition of fibrinogen. Following polymerization of the collagen I droplet in the top compartment, 100 μl of BTIC medium was added to the upper chamber and 1 ml of 10% FBS supplemented BTIC medium was applied to the lower well. Cells were then allowed to invade out of the three‐dimensional collagen I matrix, across the membrane, at 37°C for 48 h. Non‐invasive cells were then removed from the top compartment of the transwell with a cotton swab and the invasive cells present on the underside of the membrane were fixed and stained with hematoxylin. The number of invasive cells was counted per field (20x objective) from four random fields of each membrane.
2.12. Time‐lapse live cell imaging of BTIC growth
Sphere speed and displacement were analyzed via live imaging using a real‐time cell imaging system (IncuCyte live‐cell ESSEN BioScience Inc). Images of the cells were taken every 30 min over 48 h. The images were then compiled as a sequence and underwent 3D drift correction to correct for the movement of the microscope using the ImageJ software. The image sequences were then analyzed for speed and displacement using the Imaris software (Bitplane, version 9.2.0).
2.13. Statistics
Statistical analyses of BTIC sphere size, sphere number, cell number, and cell adhesion were carried out using a One‐Way Analysis of Variance (ANOVA) with Tukey's post‐hoc comparisons. Analysis of BTIC speed, displacement, and invasion was carried out by an independent samples t‐test. All statistical procedures were carried out by GraphPad Prism version 6.0. Differential expression and hierarchical clustering analyses were performed on R version 4.0.0. The threshold for statistical significance was p < 0.05.
3. RESULTS
3.1. Selected ECM molecules are differentially expressed in the GBM microenvironment
Data mining from the TCGA and GTEx databases revealed the differential expression of ECM genes within the GBM microenvironment both between different patients and compared to normal human brain tissues; ECM molecules that have been previously described to be involved in GBM biology are shown (Figure 1A). Brevican (BCAN), versican (VCAN), heparan sulfate proteoglycan 2 (HSPG2), and fibronectin 1 (FN1) transcripts were upregulated in different subtypes of GBM (classical, neural, proneural, and mesenchymal) relative to normal human brain tissues, as were laminin subunits laminin β‐1 (LAMB1), laminin α‐4 (LAMA4), laminin γ‐1 (LAMC1), laminin γ‐3 (LAMC3), and laminin β‐2 (LAMB2) (Figure 1A). Differential expression of laminin α‐3 (LAMA3) was noted in GBM samples where it was prominently downregulated in most specimens but upregulated in some (Figure 1A). The three fibrinogen subunits FGA, FGB, and FGG were expressed at comparable or slightly lower levels relative to normal brain tissues (Figure 1A).
FIGURE 1.
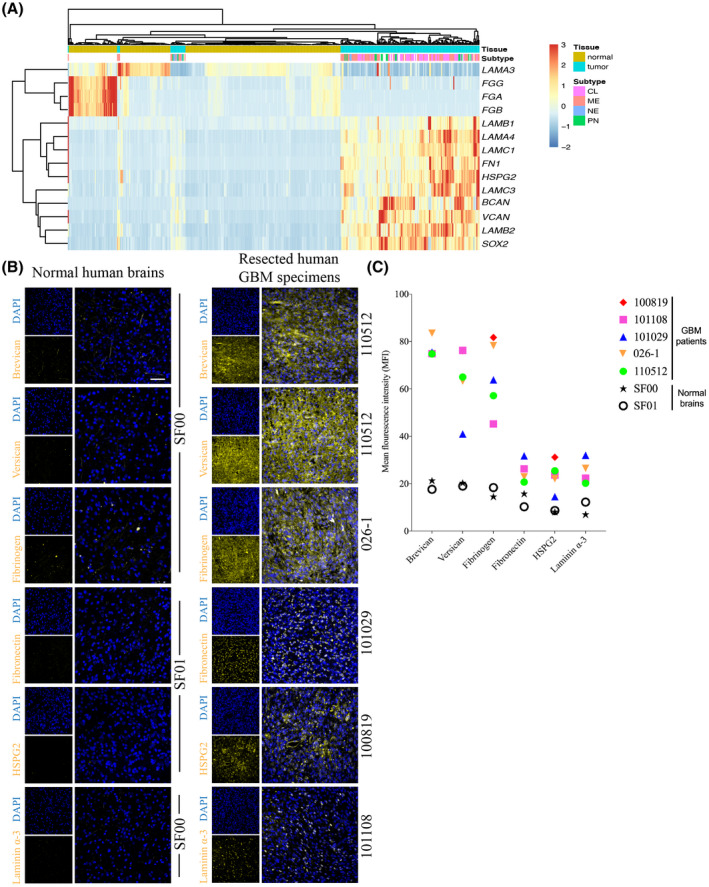
Expression of extracellular matrix molecules in the tumor microenvironment of glioblastoma patients. (A) A heat map describing the expression of transcripts encoding several ECM molecules in human GBMs and normal human brain tissues using data from the TCGA and GTEx databases. Normal or GBM tumor tissues are shown on the top row, with the corresponding ECM components below. LAMC3: laminin γ‐3; FGA, FGB, and FGG: three fibrinogen subunits; LAMB1 and LAMB2: laminin subunits laminin β‐1 and β‐2; LAMA4 and LAMC1: laminin α‐4 and laminin γ‐1; FN1: fibronectin 1; HSPG2: heparan sulfate proteoglycan 2; BCAN: brevican; and VCAN: versican. GBM subtypes: Proneural (PN), Mesenchymal (ME), Neural (NE), and Classical (CL). (B) Tissue staining of various ECM molecules in resected human specimens from five GBM patients (110512, 026‐1, 101029, 100819, and 101108), confirming their presence and comparing their expression levels relative to two different normal brain tissue samples (SF00 and SF01). Scale bar 50 µm. All images were obtained using confocal microscopy. (C) The mean fluorescence intensity (MFI) of ECM molecules in GBM tissues imaged by immunofluorescence microscopy. Each point on the graph indicates the mean of MFIs across three areas of the GBM tissue from one patient
Immunofluorescence staining of human specimens resected from GBM patients (Table 1) for brevican, versican, fibronectin, and HSPG2 corroborated the transcriptomic data, demonstrating greater expression in GBM samples from five different patients compared to normal human brain tissues (Figure 1B). Interestingly, fibrinogen and laminin α‐3 immunofluorescence staining contradicted the transcriptomic data as they were elevated in the GBM samples compared to normal brain tissues (Figure 1B). Next, we measured the mean fluorescence intensity (MFI) of each ECM molecules of each section of the resected tumor specimens. Brevican, versican, and fibrinogen were found to have the greatest MFI of expression in the tumors from all five patients (Figure 1B,C). Fibronectin, HSPG2, and intracellular laminin α‐3 demonstrated similar levels of MFI, and appeared to have lower MFIs compared to the other three ECM molecules (Figure 1C).
TABLE 1.
Patient characterization of specimens resected from clinical samples
| Patient | IDH1 | EGFR | PTEN | MGMT | New or recurrence | Gender | Age, years |
|---|---|---|---|---|---|---|---|
| 101108 | Wild‐type | Mutant | Mutant | Methylated | New | Female | 57 |
| 101029 | Wild‐type | Wild‐type | Mutant | Unmethylated | New | Male | 78 |
| 101220 | Wild‐type | Wild‐type | Mutant | Unmethylated | New | Male | 60 |
| 100819 | Wild‐type | Mutant | Mutant | Unmethylated | New | Male | 54 |
| 110512 | Wild‐type | Mutant | Mutant | Partial methylation | New | Male | 59 |
| 026‐1 | Wild‐type | No information available |
3.2. Correspondence of selected ECM Molecules and BTICs within the human GBM microenvironment
We then investigated whether the upregulated ECM molecules were correspondent to BTICs in the human GBM microenvironment. While no universal single marker is able to define the BTIC population, many studies have identified BTICs based on cell surface or intracellular markers such as CD133, CD90, CD44, nestin, musashi1, SOX2, or Olig2 (43, 44, 45). In this study we used SOX2, a transcription factor commonly applied for BTIC identification within the tumor microenvironment (46, 47). Areas of tumor with clusters of SOX2+ cells were then evaluated for ECM molecules. Qualitative analysis of images showed that all the ECM components investigated in this study (brevican, versican, fibrinogen, fibronectin, HSPG2, and laminin α‐3) were in proximity to, and surrounding cells expressing SOX2 (Figures 2 and 3), suggesting the potential for these ECM members to regulate BTIC biology.
FIGURE 2.
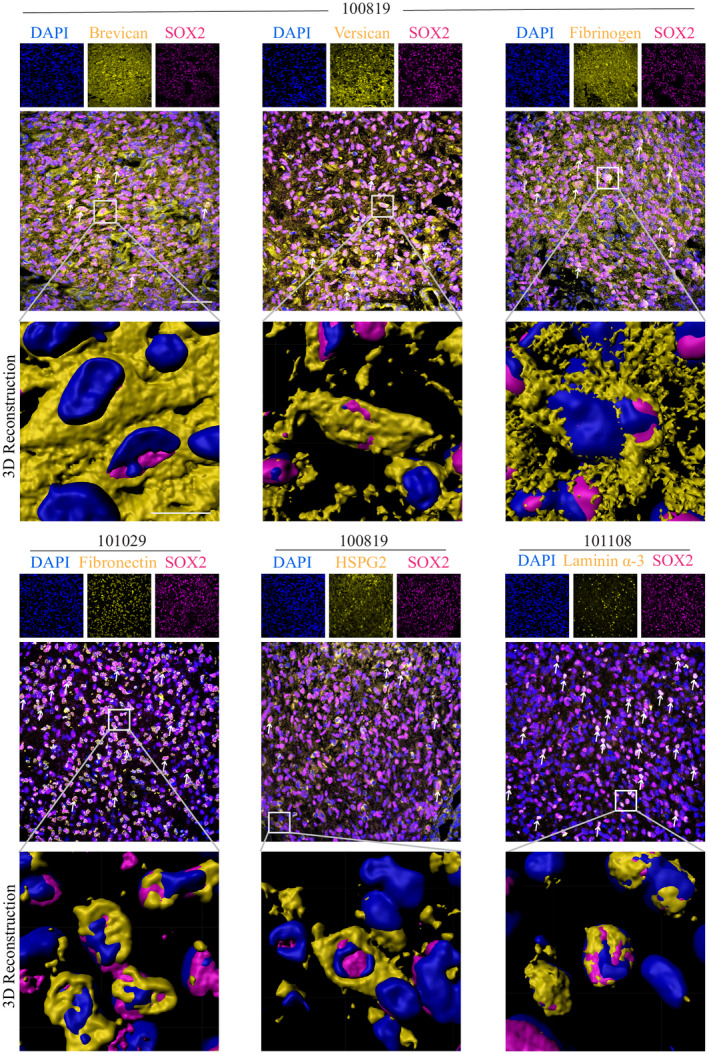
Expression of ECM molecules in the vicinity of BTICs within the GBM microenvironment. Immunofluorescence staining assessing the proximity of ECM molecules and SOX2+ cells in human GBM tissues from three patients (100819, 101029, and 101108). Double‐positive cells are indicated with white arrows. 3D reconstruction of images was obtained using the Imaris software to visualize the potential interaction between the SOX2+ cells and ECM molecules. The images were taken in GBM areas with large populations of SOX2+ cells and were not representative of the entire tumor. All images were obtained using confocal microscopy. Scale bars 10 µm
FIGURE 3.
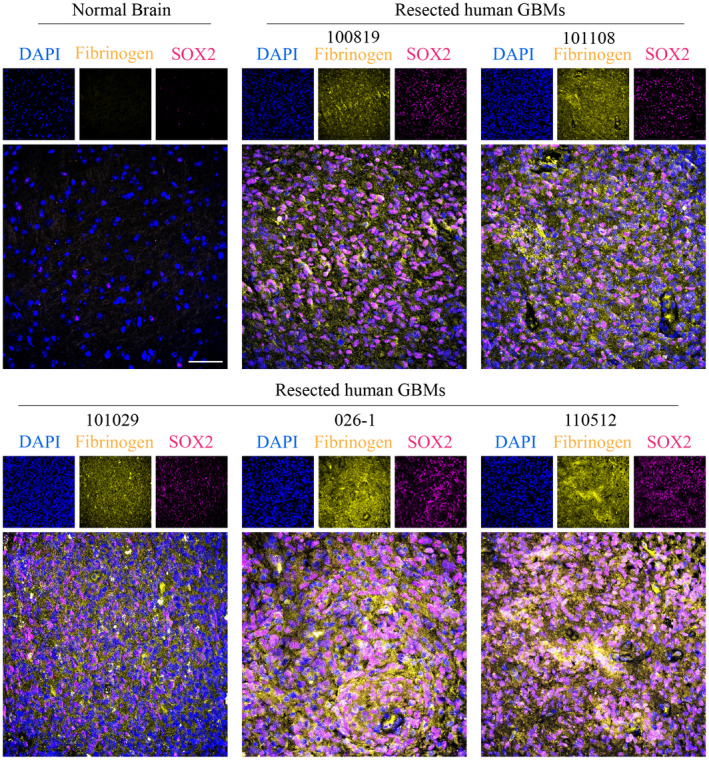
Expression of fibrinogen in the proximity of BTICs in the GBM microenvironment. Immunofluorescence staining of fibrinogen and SOX2 in normal human brain tissue (AF12) and five human GBM tissue specimens (100819, 101108, 101029, 026‐1, and 110510). The cell nuclei were stained with DAPI. Scale bas 50 µm
3.3. ECM molecules have different effects on BTICs in vitro
Given the proximity of BTICs to ECM components in tumor specimens, we addressed their effects on BTIC growth and stemness property through ATP luminescence and sphere‐forming capacity, respectively. BTIC lines BT100 and BT073 isolated from GBM patients (Table 2). Immunofluorescence microscopy and flow cytometry analysis affirmed that high proportion of BTICs in culture express BTIC markers musashi1, CD90, and nestin (Figure S1A,B). Also, sphere formation assay corroborated the self‐renewal capacity of BTIC lines (Figure S1C). The BTIC lines were cultured in the presence of fibronectin, pan‐laminin, and fibrinogen. Fibronectin and pan‐laminin increased cellular proliferation as determined by ATP luminescence, but instead of expanding sphere growth, the BTICs adhered onto the substratum where they differentiated morphologically (Figure 4A–D). In contrast, BTICs treated with fibrinogen retained sphere forming capacity and, indeed, sphere size appeared larger than controls while there were fewer number of spheres (Figure 4A). ATP luminescence shows that there was marginal elevation in fibrinogen‐treated cultures (Figure 4D).
TABLE 2.
Identification of a panel of patient‐derived BTIC lines
| Cell line | IDH1 | EGFR | PTEN | p53 | MGMT | New or recurrent | Treatment | Gender | Age, years |
|---|---|---|---|---|---|---|---|---|---|
| BT048 | Wild‐type | Mutant | Mutant | Wild‐type | Methylated | New | Unknown | Male | 68 |
| BT073 | Wild‐type | vIIIa | Mutant | Mutant | Unmethylated | Unknown | Unknown | Male | 52 |
| BT100 | Wild‐type | Wild‐type | Wild‐type | Wild‐type | Unmethylated | New | No treatment | Male | 63 |
vIII indicates EGFR variant III.
FIGURE 4.
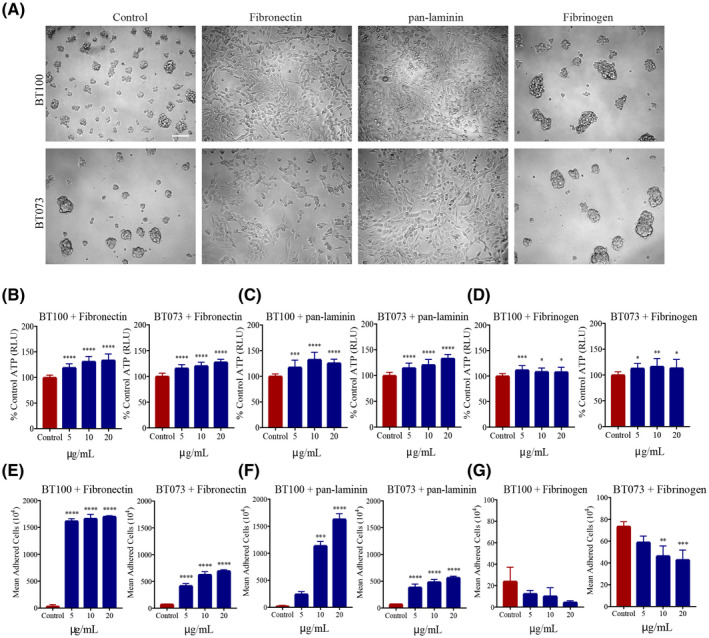
Differential effect of ECM molecules on BTIC proliferation in vitro. (A) Bright‐field microscopy images showing the differential effects of fibronectin, pan‐laminin, and fibrinogen (20 µg/ml) on patient‐derived BTIC lines (BT100 and BT073) when cultured in vitro. Images are representative of two independent experiments. Scale bar 100 µm. Bar graphs depicting the effect of (B) fibronectin, (C) pan‐laminin, and (D) fibrinogen on ATP production in two cell lines when cultured at increasing ECM concentrations. Data representative of two independent experiments. Quantification of cell adhesion after exposing to increasing concentrations of (E) fibronectin, (F) pan‐laminin, and (G) fibrinogen. BTICs in the control conditions were cultured in the absence of ECM molecules. *p < 0.05, **p < 0.001, ***p < 0.001, ****p < 0.0001 compared to control (1‐way ANOVA with Tukey's multiple comparisons); n = 4 for all groups (for B‐G). Data are represented as mean ± SEM
We corroborated the effects of fibronectin and pan‐laminin on cellular adhesion by counting the adherent cells upon treatment with these ECM molecules. There was an increase in the number of adherent cells that occurred in a concentration dependent manner (Figure 4E,F). Fibrinogen, however, had the opposite effect and decreased further the low number of adherent cells commonly seen in control wells (Figure 4G). Taken together, these findings showed that fibronectin and pan‐laminin have similar effects on BTIC proliferation and cell adhesion, while fibrinogen may cause spheres to coalesce together forming fewer but larger clusters in culture.
3.4. Fibrinogen enhances BTIC intercellular adhesion, and elevates the motility of BTICs
The apparent effect of fibrinogen on larger spheres prompted us to focus on this ECM protein, particularly on sphere size and the mean number of spheres in culture. Using BT073 and BT100, and an additional BT048 patient‐derived line, we observed larger and fewer numbers of spheres when cultured in increasing concentrations of fibrinogen (Figure 5A–C). Self‐renewal capacity was not a factor in the increased sphere size since extreme limiting dilution assays revealed no significant difference between treated cells and controls (Figure 5D,E). Opposite to BTICs, fibrinogen did not increase proliferation and sphere size of non‐transformed human neural stem cells (Figure S2). Flow cytometry of untreated BTICs in the serum‐free culture medium showed that a proportion of BTICs expressed fibrinogen on their surface: BT073 (36.1%) and BT048 (9.16%) (Figure 5F).
FIGURE 5.
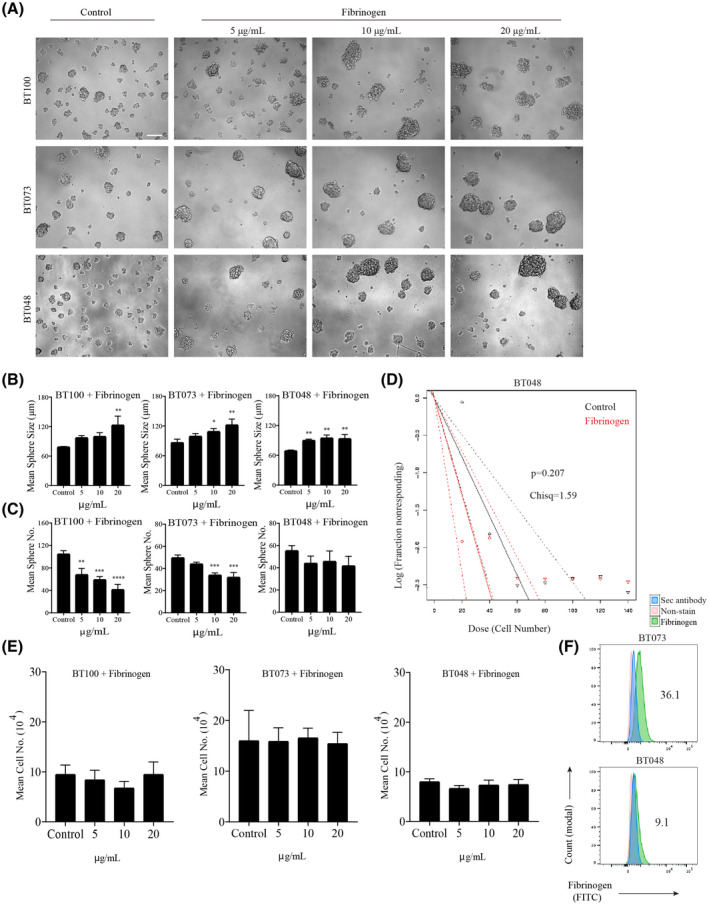
Effect of fibrinogen on BTIC proliferation and sphere formation capacity. (A) Bright‐field microscopy images of three BTIC lines (BT100, BT073, and BT048) demonstrating the effect on sphere size and sphere number when the BTICs were cultured in the presence of increasing concentrations of fibrinogen; the control BTICs were cultured in the absence of ECM protein in three independent experiments. (B) Quantification of sphere size and (C) sphere number by manual sphere measurement and counting when the BTIC lines were cultured with increasing concentrations of fibrinogen. Data representative of three separate experiments for each cell line. (D) An extreme limiting dilution assay (ELDA) demonstrating the effect of fibrinogen (20 µg/ml) on BTICs. BT048 was plated at increasing cell numbers from 20 to 140 cells in 20 cell increments in a total volume of 200 µL, and maintained for 8 days. (E) Manual cell counting of BTIC lines (BT100, BT073, and BT048) cultured with increasing concentrations of fibrinogen. (F) Flow cytometry plots demonstrate fibrinogen expression on BTIC lines (BT073 and BT048). Cells that did not undergo staining and those stained exclusively with secondary antibody were used as controls. Numbers in the FACS plots show the percentage of positive cells. *p < 0.05, **p < 0.01, ***p < 0.001 ****p < 0.0001 compared to control (one‐way ANOVA with Tukey's multiple comparisons); n = 4 for all groups (B, C, D). Data are represented as mean ± SEM
We monitored growth of BTICs by time‐lapse live cell imaging over a 45‐hour period to evaluate whether BTIC cells coalesce when exposed to exogenously applied fibrinogen. Indeed, we observed that BTICs moved more rapidly in solution and merged with other BTICs in the presence of fibrinogen resulting in larger spheres (Figure 6A and Movie S1). Visualization of these migration patterns through sphere tracking revealed that fibrinogen‐treated BTICs migrated towards other BTIC spheres over greater distances in a given period relative to control BTICs (Figure 6B). Overall, the average displacement and speed of these BTICs, when calculated for each time point, revealed that BTICs were more motile and covered greater distances in fibrinogen compared to control condition (Figure 6C). Taken together, these experiments show that fibrinogen facilitates the adhesive property, motility, and invasiveness of BTICs.
FIGURE 6.
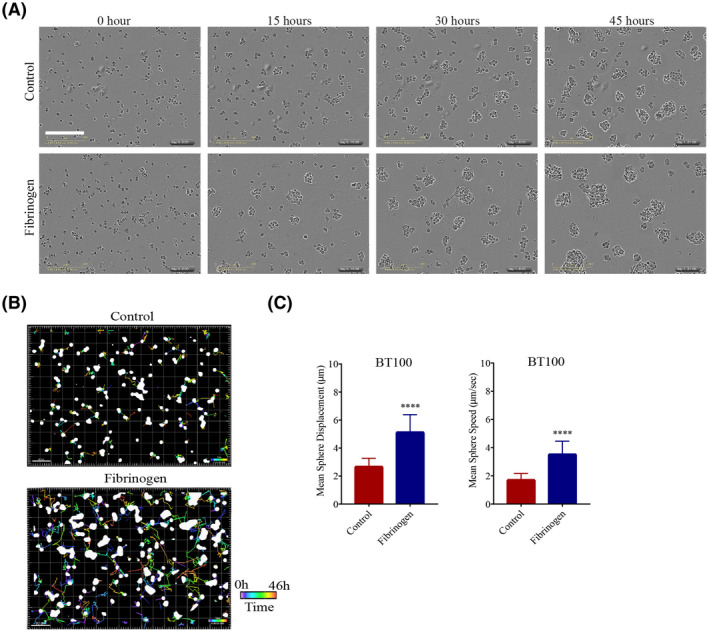
Fibrinogen modulates motility and invasiveness of BTICs in culture. (A) Bright‐field microscopy images of BT100 cultured with or without fibrinogen (20 µg/ml), captured in 15‐hour increments over a period of 45 h using the IncuCyte Live Cell Analysis System in two independent experiments. Please see Movie S1 for video. (B) BTIC sphere tracks depicting the movement of the spheres over a 46.5‐hour period under control or fibrinogen culture conditions in two independent experiments. The colored lines indicate the movement of the spheres over time. The time bar is shown in the bottom right corners of the images. Scale bars 80 µm. (C) Quantification of BTIC sphere displacement when BTICs were cultured in the presence of fibrinogen (20 µg/ml) versus control. Data are represented as mean ± SEM (n of 4). ****p < 0.0001 (Student's t‐test)
3.5. Fibrinogen promotes BTIC invasiveness through matrix metalloproteinase‐2 and ‐9
Given the increased motility seen in BTICs treated with fibrinogen, we then asked whether it would have a positive influence on BTIC invasiveness. Within a tumor specimen, many factors regulate invasive properties, including the elaboration of matrix metalloproteinases (MMPs) such as MMP‐2 and ‐9 (42). Indeed, in resected GBM specimens, immunofluorescence analyses showed that in SOX2‐positive BTIC‐containing areas, fibrinogen and MMP‐2 or ‐9 were in proximity and likely within the same cells (Figure 7A,B); this was demonstrated in 3 of 3 specimens analyzed.
FIGURE 7.
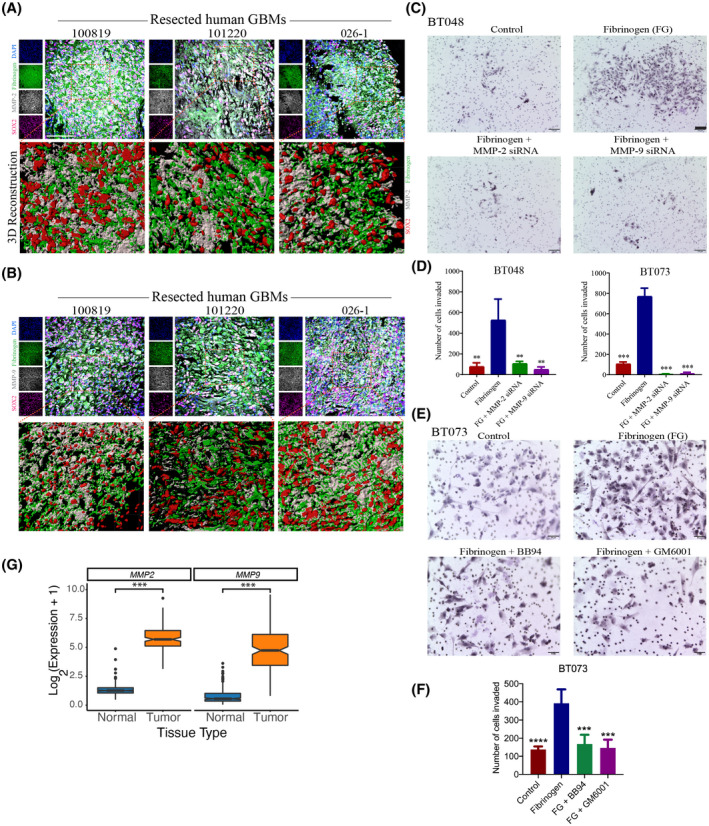
Fibrinogen promotes BTIC invasiveness through matrix metalloproteinase‐2 and ‐9. Immunofluorescence staining of three human GBM specimens (100819, 101220, and 026‐1) for fibrinogen, SOX2, and (A) MMP‐2 or (B) MMP‐9. Scale bar 50 µm. (C) Bright‐field microscopy images of control, MMP‐2, and ‐9 knock‐down cells in presence or absence of fibrinogen (BT048) Cells were cultured in the Boyden Chamber membrane using transwell insert, where dark purple indicates individual BTIC nuclei that have invaded through the 3D matrix of type I collagen to the other side of the membrane. Scale bars 100 µm. (D) Quantification of invasion in MMP‐2 or MMP‐9 knock‐down BTIC (BT048 and BT073) following treatment with fibrinogen. (E) Bright‐field microscopy images of invasion assay of BT073 in the presence or absence of fibrinogen and MMP‐2 and ‐9 inhibitors Batimastat (BB94; 500 nM) or Ilomastat (GM6001; 10 μM). Scale bars 50 µm. (F) Quantification of invasion of BT073 following treatment with BB94 or GM6001. (G) Box plots visualizes the expression of MMP2 and MMP9 genes in GBM tissues versus normal brains in TCGA‐GBM and GTEx normal brain databases. **p < 0.01, ***p < 0.001, **** p < 0.0001 compared to fibrinogen (one‐way ANOVA with Tukey's multiple comparisons); n = 4 for all groups
Finally, to ascertain a functional relationship between fibrinogen and cellular invasiveness, we returned to an in vitro Boyden chamber model of BTIC invasion across a collagen barrier. The collagen was embedded with fibrinogen or not, with the latter serving as controls. At 48 h after cells were plated onto the top compartment, we found that a greater number of cells have invaded across the fibrinogen/collagen membrane compared to controls (Figure 7C,D). We also addressed the effects of fibrinogen on invasion of differentiated GBM lines, U251 and U87. Like BTICs, higher number of invaded cells were observed in the presence of fibrinogen (Figure S3). Moreover, this effect of fibrinogen‐induced invasiveness was attenuated in BTICs where MMP‐2 and ‐9 have been downregulated with siRNA (Figure 7C,D).
We also pharmacologically inhibited the MMP‐2 and ‐9 by supplementing the collagen membrane with Batimastat (BB94) or Ilomastat (GM6001) 1 h before adding fibrinogen. There were a smaller number of invaded cells in the presence of BB94 or GM6001 compared to control (Figure 7E,F). Finally, analysis of mRNA expression of MMP2 and MMP9 genes in the GBM samples versus normal tissues in TCGA‐GBM and GTEx normal brain databases showed higher expression of both genes in the tumor samples versus normal tissues (p < 0.001, Wilcoxon Rank Sum test) (Figure 7G).
4. DISCUSSION
In the present study, we describe that several ECM components are upregulated in the human GBM microenvironment, and that they have differential effects on BTICs. Transcriptomic data from GBM databases identified elevated level of LAMB1, LAMB2, LAMA4, LAMC1, and LAMC3, FN1, HSPG2, BCAN, and VCAN compared to normal brains. Tissue staining corroborated the upregulation of brevican, versican, fibronectin, and HSPG2 in human GBM specimens compared to normal brains. However, opposite to transcriptomic data, we observed an increased expression of fibrinogen and laminin α‐3 at protein levels in GBM tissues compared to normal brains.
Growing evidence suggests that ECM molecules within the tumor microenvironment create a physical and biochemical niche for cancer cells including cancer stem cells (48, 49). We found that brevican, versican, fibrinogen, fibronectin, HSPG2, and laminin α‐3 were in proximity to, and surrounding, BTICs. Consistent with our finding, another study has shown that BTICs express brevican to promote their own invasiveness, through interaction with other ECM molecules like fibronectin (31, 50).
The overexpression of fibronectin contributes to an aggressive GBM phenotype by promoting a variety of functions, including angiogenesis, migration, cell proliferation, and treatment resistance (28). It has been found that the tumor cells are capable of synthesizing fibronectin, leading to elevation of its levels both within the microenvironment and the peripheral blood of GBM patients (23, 28).
Our data also found that fibronectin induced BTIC differentiation. These findings were also demonstrated in a study (23) where BTICs cultured in increasing concentrations of fibronectin had significantly reduced SOX2 expression and increased GFAP expression. The current study also found that fibronectin increases BTIC cell adhesion and proliferation.
Our study also found that laminin α‐3 were upregulated within the GBM tissues compared with normal brains in immunohistochemistry. However, transcriptomic data from the TCGA and GTEx databases demonstrated that this elevation is not common among GBM patients. Among different subunits, laminin α‐2 has been shown to promote BTIC stemness, adhesion, migration, growth, and survival (22). Laminin has also been used to propagate GBM stem cells under adherent conditions (51). This supports our findings in that BTICs cultured in the presence of pan‐laminin were more adherent to the wells and also had greater levels of ATP, likely indicating increased BTIC proliferation.
Proteoglycans including HSPGs are an important ECM component of the normal brain that have significant roles in brain development, function, and tumorigenesis (32, 52). Consistent with our finding, other studies have observed HSPG upregulation within the GBM microenvironment. For instance, HSPG2 is upregulated in the GBM and has been shown to be an indicator of poor prognosis (53, 54). HSPG consistently undergo structural modifications to both their core protein and heparan sulfate chains in GBMs (54). Furthermore, proteoglycans contribute to the phenotype and therapeutic resistance of cancer stem cells in different types of cancer (55). In our study, we observed HSPG2 expression in the proximity of BTICs.
Very little information exists regarding the role of fibrinogen in GBM, particularly with its effect on BTICs. However, preoperative plasma fibrinogen levels have been shown to be associated with poor clinical outcome in glioblastoma patients (56). Immunofluorescence staining in our study demonstrated the presence of fibrinogen within the GBM microenvironment in proximity to BTICs despite the relatively normal level of fibrinogen transcript within GBM in the transcriptomic database. These findings support previous research that suggests that the GBM may utilize plasma fibrinogen to attract growth factors and suppress the immune system (56). Interestingly, fibrinogen promotes the migration of endothelial cells (57), a key event in angiogenesis. Also, fibrinogen increases microvascular permeability (58). Thus, higher deposition of fibrinogen within the GBM microenvironment than normal tissues might be because of vascularized feature of GBM tissues. Also, post‐translational modifications such as glycosylation may stabilize fibrinogen deposited in the tumor microenvironment and explain the discrepancy between mRNA and protein levels. Also, by flow cytometry analysis we noted surface expression of fibrinogen on BTIC lines. The surface expression might be a result of deposition of extracellular fibrinogen on the cell membrane. BTIC lines (BT048 and BT073) with different expression levels of fibrinogen displayed similar levels of intercellular adhesion and motility. These data emphasize that extracellular fibrinogen from plasma may affect intercellular adhesion and motility of BTICs rather than the fibrinogen expressed by BTICs.
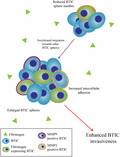
Fibrinogen has been shown to contribute substantially to GBM growth, proliferation, and angiogenesis, and promotes an overall malignant phenotype with reduced patient survival (59). Our results suggest that fibrinogen increases intercellular adhesion leading to a significant increase in sphere size and a significant decrease in sphere number. The present study also demonstrates the enhanced displacement, and invasiveness, of BTICs treated with fibrinogen. These findings are supported by previous literature that GBM degrades fibrinogen into fibrin for increasing tumor metastasis (59). The presence of MMP‐2 and ‐9 and fibrinogen‐associated BTICs in the GBM microenvironment further support this, as MMP‐2 and ‐9 are highly correlated with ECM remodeling and GBM malignancy (60, 61). Downregulation or pharmacological inhibition of MMP‐2 and ‐9 in BTICs abrogated the promoting effects of fibrinogen on invasiveness; suggesting that fibrinogen may enhance invasiveness through upregulation of MMP‐2 and ‐9. Taken together, these findings suggest that, fibrinogen is present in the GBM microenvironment and may be expressed by BTICs to promote a more aggressive GBM phenotype; the effects of fibrinogen on BTICs are summarized in Figure 8.
FIGURE 8.
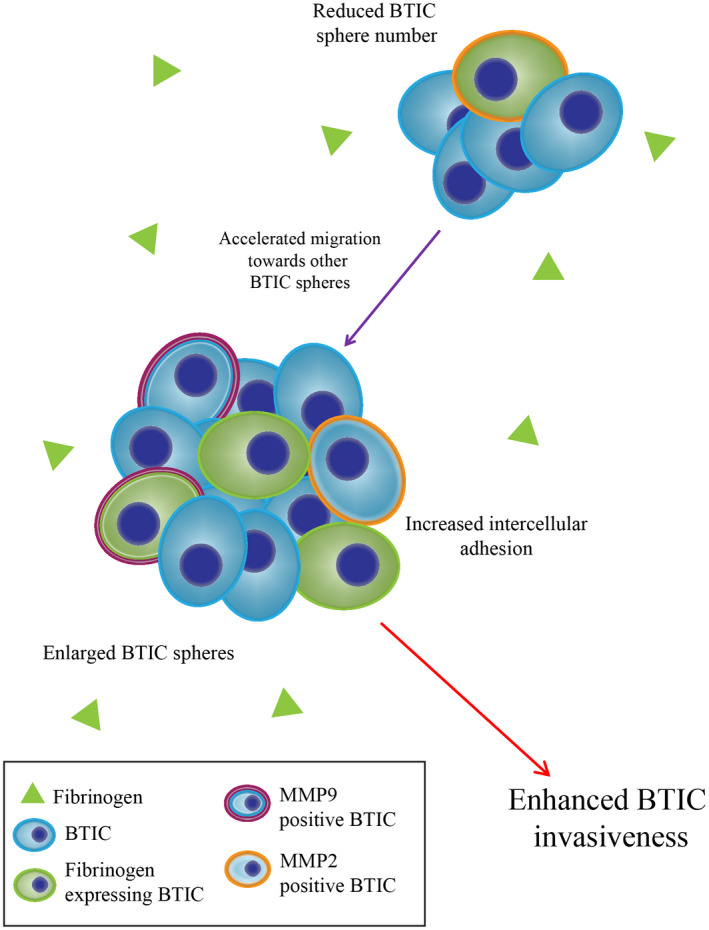
A schematic diagram depicting fibrinogen's effects on BTICs in vitro. Fibrinogen is in the vicinity of BTICs, and enhances their invasiveness along with expression of MMP‐2 and ‐9. Fibrinogen also increases sphere size and reduces sphere number by enhancing BTIC migration toward other BTIC spheres
In summary, several ECM components are elevated in the vicinity of BTICs in human GBM specimens. Although transcript levels were not elevated in GBM compared to normal brain, fibrinogen immunoreactivity was high in GBM in situ, likely reflecting the deposition of blood‐derived fibrinogen through the highly leaky blood vessels in GBM. The fibrinogen in proximity to BTICs may regulate the latter's invasive properties. Thus, targeting fibrinogen activity in GBMs may reduce the propensity of BTICs to invade to other brain areas to set up new foci of tumor growth. We conclude that ECM components, particularly fibrinogen, in GBM are an important target for therapeutics.
CONFLICT OF INTEREST
The authors declare no conflict of interests.
AUTHOR CONTRIBUTIONS
Lauren Dzikowski, Reza Mirzaei, and V. Wee Yong conceptualized the study. Lauren Dzikowski, Reza Mirzaei, Susobhan Sarkar, and Mehul Kumar obtained data while Pinaki Bose supervised the mining of the RNA databases. Anita Bellail and Chunhai Hao oversaw and provided the glioblastoma tissue sections. Lauren Dzikowski and Reza Mirzaei generated the first draft and all authors edited the manuscript. V. Wee Yong supervised the entire study and finalized the manuscript.
Supporting information
FIGURE S1 Expression of stemness markers and self‐renewal capacity of BTICs. (A) The intracellular expression of stemness marker musashi1 in two BTIC lines by immunofluorescence staining of cells in culture. (B) Flow cytometry analysis of surface expression of stemness markers CD90 and nestin on live BTICs. (C) Sphere formation assay affirmed the self‐renewal capacity of BTICs
FIGURE S2 Effects of fibrinogen on human neural stem cells. Human neural stem cells isolated from brain tissues of human fetuses and human BTIC line BT073 were treated with different concentration of fibrinogen. (A) Cell growth were observed after 72 h using the IncuCyte Live Cell Analysis System. Representative of two independent experiments. (B) ATP proliferation assay of human NSCs and BT073 following treatment with fibrinogen for 72 hours. Data are represented as mean ± SEM (n of 6). *p < 0.05 and ****p < 0.0001 compared to control (one‐way ANOVA with Tukey's multiple comparisons). ns, not significant
FIGURE S3 Effects of fibrinogen on migration of differentiated GBM lines. (A) Bright‐field microscopy images of U251 GBM line, in the presence or absence of fibrinogen. Scale bars 50 µm. (B) Quantification of invasion in GBM lines (U251 and U87) following treatment with fibrinogen. ***p < 0.001 compared to control (one‐way ANOVA with Tukey's multiple comparisons)
MOVIE S1 Bright‐field time‐lapse live imaging of BTICs after treatment with fibrinogen (20 µg/ml) and observed over a 46.5‐hour period in 30‐minute intervals using the IncuCyte Live Cell Analysis System. Representative of two independent experiments. The time each image was taken is located in the bottom right corner. Scale bar 200 µm
ACKNOWLEDGMENTS
This study was supported by grants from the Canadian Institutes of Health Research and the Canadian Cancer Society. RM is supported by a University of Calgary Eyes High postdoctoral scholarship. We acknowledge the Hotchkiss Brain Institute Advanced Microscopy Platform and the Cumming School of Medicine for support and use of Leica TCS SP8 and ImageXpress Micro XLS High‐Content Analysis System. We thank the Snyder Institute's Live Cell Imaging Resource laboratory at the University of Calgary. We also thank the Flow Cytometry Core facility and BTIC Core headed by Samuel Weiss and Gregory Cairncross for isolating BTIC lines from patient‐resected specimens.
Lauren Dzikowski and Reza Mirzaei are co‐first authors.
DATA AVAILABILITY STATEMENT
We confirm that the primary data of this manuscript will be made available for sharing when requested.
REFERENCES
- 1.Neftel C, Laffy J, Filbin MG, Hara T, Shore ME, Rahme GJ, et al. An Integrative model of cellular states, plasticity, and genetics for glioblastoma. Cell. 2019;178(4):835–49.e21. [DOI] [PMC free article] [PubMed] [Google Scholar]
- 2.Perry JR, Laperriere N, O'Callaghan CJ, Brandes AA, Menten J, Phillips C, et al. Short‐course radiation plus temozolomide in elderly patients with glioblastoma. N Engl J Med. 2017;376:1027–37. [DOI] [PubMed] [Google Scholar]
- 3.Stupp R, Mason WP, van den Bent MJ, Weller M, Fisher B, Taphoorn MJ, et al. Radiotherapy plus concomitant and adjuvant temozolomide for glioblastoma. N Engl J Med. 2005;352:987–96. [DOI] [PubMed] [Google Scholar]
- 4.Stupp R, Taillibert S, Kanner A, Read W, Steinberg DM, Lhermitte B, et al. Effect of tumor‐treating fields plus maintenance temozolomide vs maintenance temozolomide alone on survival in patients with glioblastoma a randomized clinical trial. JAMA. 2017;318:2306–16. [DOI] [PMC free article] [PubMed] [Google Scholar]
- 5.Vora P, Seyfrid M, Venugopal C, Qazi MA, Salim S, Isserlin R, et al. Bmi1 regulates human glioblastoma stem cells through activation of differential gene networks in CD133+ brain tumor initiating cells. J Neurooncol. 2019;143:417–28. [DOI] [PubMed] [Google Scholar]
- 6.Chen J, Li Y, Yu TS, McKay RM, Burns DK, Kernie SG, et al. A restricted cell population propagates glioblastoma growth after chemotherapy. Nature. 2012;488:522–6. [DOI] [PMC free article] [PubMed] [Google Scholar]
- 7.Liu Y, Shen Y, Sun T, Yang W. Mechanisms regulating radiosensitivity of glioma stem cells. Neoplasma. 2017;64:655–65. [DOI] [PubMed] [Google Scholar]
- 8.Ong DST, Hu B, Ho YW, Sauve CG, Bristow CA, Wang Q, et al. PAF promotes stemness and radioresistance of glioma stem cells. Proc Natl Acad Sci U S A. 2017;114:E9086–95. [DOI] [PMC free article] [PubMed] [Google Scholar]
- 9.Friebel E, Kapolou K, Unger S, Nunez NG, Utz S, Rushing EJ, et al. Single‐cell mapping of human brain cancer reveals tumor‐specific instruction of tissue‐invading leukocytes. Cell. 2020;181:1626–42. [DOI] [PubMed] [Google Scholar]
- 10.Hai L, Liu P, Yu S, Yi L, Tao Z, Zhang C, et al. Jagged1 is clinically prognostic and promotes invasion of glioma‐initiating cells by activating NF‐kappaB(p65) signaling. Cell Physiol Biochem. 2018;51:2925–37. [DOI] [PubMed] [Google Scholar]
- 11.Sarkar S, Zemp FJ, Senger D, Robbins SM, Yong VW. ADAM‐9 is a novel mediator of tenascin‐C‐stimulated invasiveness of brain tumor‐initiating cells. Neuro Oncol. 2015;17:1095–105. [DOI] [PMC free article] [PubMed] [Google Scholar]
- 12.Sun MZ, Kim JM, Oh MC, Safaee M, Kaur G, Clark AJ, et al. Na(+)/K(+)‐ATPase beta2‐subunit (AMOG) expression abrogates invasion of glioblastoma‐derived brain tumor‐initiating cells. Neuro Oncol. 2013;15:1518–31. [DOI] [PMC free article] [PubMed] [Google Scholar]
- 13.Couturier CP, Ayyadhury S, Le PU, Nadaf J, Monlong J, Riva G, et al. Single‐cell RNA‐seq reveals that glioblastoma recapitulates a normal neurodevelopmental hierarchy. Nat Commun. 2020;11(1):3406. [DOI] [PMC free article] [PubMed] [Google Scholar]
- 14.Lathia JD, Mack SC, Mulkearns‐Hubert EE, Valentim CL, Rich JN. Cancer stem cells in glioblastoma. Genes Dev. 2015;29:1203–17. [DOI] [PMC free article] [PubMed] [Google Scholar]
- 15.Sampetrean O, Saya H. Characteristics of glioma stem cells. Brain Tumor Pathol. 2013;30:209–14. [DOI] [PubMed] [Google Scholar]
- 16.Niibori‐Nambu A, Midorikawa U, Mizuguchi S, Hide T, Nagai M, Komohara Y, et al. Glioma initiating cells form a differentiation niche via the induction of extracellular matrices and integrin alphaV. PLoS One. 2013;8:e59558. [DOI] [PMC free article] [PubMed] [Google Scholar]
- 17.Pickup MW, Mouw JK, Weaver VM. The extracellular matrix modulates the hallmarks of cancer. EMBO Rep. 2014;15:1243–53. [DOI] [PMC free article] [PubMed] [Google Scholar]
- 18.Ferrer VP, Moura Neto V, Mentlein R. Glioma infiltration and extracellular matrix: key players and modulators. Glia. 2018;66:1542–65. [DOI] [PubMed] [Google Scholar]
- 19.Kim Y, Kang H, Powathil G, Kim H, Trucu D, Lee W, et al. Role of extracellular matrix and microenvironment in regulation of tumor growth and LAR‐mediated invasion in glioblastoma. PLoS One. 2018;13:e0204865. [DOI] [PMC free article] [PubMed] [Google Scholar]
- 20.Lau LW, Cua R, Keough MB, Haylock‐Jacobs S, Yong VW. Pathophysiology of the brain extracellular matrix: a new target for remyelination. Nat Rev Neurosci. 2013;14:722–9. [DOI] [PubMed] [Google Scholar]
- 21.Sarrazin S, Lamanna WC, Esko JD. Heparan sulfate proteoglycans. Cold Spring Harb Perspect Biol. 2011;3:a004952. [DOI] [PMC free article] [PubMed] [Google Scholar]
- 22.Lathia JD, Li M, Hall PE, Gallagher J, Hale JS, Wu Q, et al. Laminin alpha 2 enables glioblastoma stem cell growth. Ann Neurol. 2012;72:766–78. [DOI] [PMC free article] [PubMed] [Google Scholar]
- 23.Yu Q, Xue Y, Liu J, Xi Z, Li Z, Liu Y. Fibronectin promotes the malignancy of glioma stem‐like cells via modulation of cell adhesion, differentiation. proliferation and chemoresistance. Front Mol Neurosci. 2018;11:130. [DOI] [PMC free article] [PubMed] [Google Scholar]
- 24.Hatoum A, Mohammed R, Zakieh O. The unique invasiveness of glioblastoma and possible drug targets on extracellular matrix. Cancer Manag Res. 2019;11:1843–55. [DOI] [PMC free article] [PubMed] [Google Scholar]
- 25.Koh I, Cha J, Park J, Choi J, Kang S‐G, Kim P. The mode and dynamics of glioblastoma cell invasion into a decellularized tissue‐derived extracellular matrix‐based three‐dimensional tumor model. Sci Rep. 2018;8:4608. [DOI] [PMC free article] [PubMed] [Google Scholar]
- 26.Sood D, Tang‐Schomer M, Pouli D, Mizzoni C, Raia N, Tai A, et al. 3D extracellular matrix microenvironment in bioengineered tissue models of primary pediatric and adult brain tumors. Nat Commun. 2019;10:4529. [DOI] [PMC free article] [PubMed] [Google Scholar]
- 27.Kawataki T, Yamane T, Naganuma H, Rousselle P, Anduren I, Tryggvason K, et al. Laminin isoforms and their integrin receptors in glioma cell migration and invasiveness: Evidence for a role of alpha5‐laminin(s) and alpha3beta1 integrin. Exp Cell Res. 2007;313:3819–31. [DOI] [PubMed] [Google Scholar]
- 28.Serres E, Debarbieux F, Stanchi F, Maggiorella L, Grall D, Turchi L, et al. Fibronectin expression in glioblastomas promotes cell cohesion, collective invasion of basement membrane in vitro and orthotopic tumor growth in mice. Oncogene. 2014;33:3451–62. [DOI] [PubMed] [Google Scholar]
- 29.Ljubimova JY, Fujita M, Khazenzon NM, Ljubimov AV, Black KL. Changes in laminin isoforms associated with brain tumor invasion and angiogenesis. Front Biosci. 2006;11:81–8. [DOI] [PMC free article] [PubMed] [Google Scholar]
- 30.Hu F, Dzaye O, Hahn A, Yu Y, Scavetta RJ, Dittmar G, et al. Glioma‐derived versican promotes tumor expansion via glioma‐associated microglial/macrophages Toll‐like receptor 2 signaling. Neuro Oncol. 2015;17:200–10. [DOI] [PMC free article] [PubMed] [Google Scholar]
- 31.Silver DJ, Silver J. Contributions of chondroitin sulfate proteoglycans to neurodevelopment, injury, and cancer. Curr Opin Neurobiol. 2014;27:171–8. [DOI] [PMC free article] [PubMed] [Google Scholar]
- 32.Wade A, Robinson AE, Engler JR, Petritsch C, James CD, Phillips JJ. Proteoglycans and their roles in brain cancer. FEBS J. 2013;280:2399–417. [DOI] [PMC free article] [PubMed] [Google Scholar]
- 33.Colaprico A, Silva TC, Olsen C, Garofano L, Cava C, Garolini D, et al. TCGAbiolinks: an R/Bioconductor package for integrative analysis of TCGA data. Nucleic Acids Res. 2016;44:e71. [DOI] [PMC free article] [PubMed] [Google Scholar]
- 34.Collado‐Torres L, Nellore A, Kammers K, Ellis SE, Taub MA, Hansen KD, et al. Reproducible RNA‐seq analysis using recount2. Nat Biotechnol. 2017;35:319–21. [DOI] [PMC free article] [PubMed] [Google Scholar]
- 35.Durinck S, Spellman PT, Birney E, Huber W. Mapping identifiers for the integration of genomic datasets with the R/Bioconductor package biomaRt. Nat Protoc. 2009;4:1184–91. [DOI] [PMC free article] [PubMed] [Google Scholar]
- 36.Kerr MK. Linear models for microarray data analysis: hidden similarities and differences. J Comput Biol. 2003;10:891–901. [DOI] [PubMed] [Google Scholar]
- 37.Law CW, Chen Y, Shi W, Smyth GK. voom: precision weights unlock linear model analysis tools for RNA‐seq read counts. Genome Biol. 2014;15:R29. [DOI] [PMC free article] [PubMed] [Google Scholar]
- 38.Mirzaei R, Sarkar S, Dzikowski L, Rawji KS, Khan L, Faissner A, et al. Brain tumor‐initiating cells export tenascin‐C associated with exosomes to suppress T cell activity. Oncoimmunology. 2018;7:e1478647. [DOI] [PMC free article] [PubMed] [Google Scholar]
- 39.Sarkar S, Yang R, Mirzaei R, Rawji K, Poon C, Mishra MK, et al. Control of brain tumor growth by reactivating myeloid cells with niacin. Sci Transl Med. 2020;12:eaay9924. [DOI] [PubMed] [Google Scholar]
- 40.Sarkar S, Doring A, Zemp FJ, Silva C, Lun X, Wang X, et al. Therapeutic activation of macrophages and microglia to suppress brain tumor‐initiating cells. Nat Neurosci. 2014;17:46–55. [DOI] [PubMed] [Google Scholar]
- 41.Chojnacki A, Kelly JJ, Hader W, Weiss S. Distinctions between fetal and adult human platelet‐derived growth factor‐responsive neural precursors. Ann Neurol. 2008;64:127–42. [DOI] [PubMed] [Google Scholar]
- 42.Sarkar S, Yong VW. Inflammatory cytokine modulation of matrix metalloproteinase expression and invasiveness of glioma cells in a 3‐dimensional collagen matrix. J Neurooncol. 2009;91:157–64. [DOI] [PubMed] [Google Scholar]
- 43.Anido J, Sáez‐Borderías A, Gonzàlez‐Juncà A, Rodón L, Folch G, Carmona MA, et al. TGF‐β receptor inhibitors target the CD44(high)/Id1(high) glioma‐initiating cell population in human glioblastoma. Cancer Cell. 2010;18:655–68. [DOI] [PubMed] [Google Scholar]
- 44.Dirkse A, Golebiewska A, Buder T, Nazarov PV, Muller A, Poovathingal S, et al. Stem cell‐associated heterogeneity in Glioblastoma results from intrinsic tumor plasticity shaped by the microenvironment. Nat Commun. 2019;10:1787. [DOI] [PMC free article] [PubMed] [Google Scholar]
- 45.Singh SK, Hawkins C, Clarke ID, Squire JA, Bayani J, Hide T, et al. Identification of human brain tumour initiating cells. Nature. 2004;432:396–401. [DOI] [PubMed] [Google Scholar]
- 46.Guerra‐Rebollo M, Garrido C, Sanchez‐Cid L, Soler‐Botija C, Meca‐Cortes O, Rubio N, et al. Targeting of replicating CD133 and OCT4/SOX2 expressing glioma stem cells selects a cell population that reinitiates tumors upon release of therapeutic pressure. Sci Rep. 2019;9:9549. [DOI] [PMC free article] [PubMed] [Google Scholar]
- 47.Hattermann K, Fluh C, Engel D, Mehdorn HM, Synowitz M, Mentlein R, et al. Stem cell markers in glioma progression and recurrence. Int J Oncol. 2016;49:1899–910. [DOI] [PubMed] [Google Scholar]
- 48.Gerarduzzi C, Hartmann U, Leask A, Drobetsky E. The matrix revolution: matricellular proteins and restructuring of the cancer microenvironment. Can Res. 2020;80:2705–17. [DOI] [PubMed] [Google Scholar]
- 49.Henke E, Nandigama R, Ergün S. Extracellular matrix in the tumor microenvironment and its impact on cancer therapy. Front Mol Biosci. 2019;6:160. [DOI] [PMC free article] [PubMed] [Google Scholar]
- 50.Dwyer CA, Bi WL, Viapiano MS, Matthews RT. Brevican knockdown reduces late‐stage glioma tumor aggressiveness. J Neurooncol. 2014;120:63–72. [DOI] [PMC free article] [PubMed] [Google Scholar]
- 51.Pollard SM, Yoshikawa K, Clarke ID, Danovi D, Stricker S, Russell R, et al. Glioma stem cell lines expanded in adherent culture have tumor‐specific phenotypes and are suitable for chemical and genetic screens. Cell Stem Cell. 2009;4:568–80. [DOI] [PubMed] [Google Scholar]
- 52.Schwartz NB, Domowicz MS. Proteoglycans in brain development and pathogenesis. FEBS Lett. 2018;592:3791–805. [DOI] [PubMed] [Google Scholar]
- 53.Kazanskaya GM, Tsidulko AY, Volkov AM, Kiselev RS, Suhovskih AV, Kobozev VV, et al. Heparan sulfate accumulation and perlecan/HSPG2 up‐regulation in tumour tissue predict low relapse‐free survival for patients with glioblastoma. Histochem Cell Biol. 2018;149:235–44. [DOI] [PubMed] [Google Scholar]
- 54.Xiong A, Kundu S, Forsberg‐Nilsson K. Heparan sulfate in the regulation of neural differentiation and glioma development. FEBS J. 2014;281:4993–5008. [DOI] [PubMed] [Google Scholar]
- 55.Vitale D, Katakam SK, Greve B, Jang B, Oh ES, Alaniz L, et al. Proteoglycans and glycosaminoglycans as regulators of cancer stem cell function and therapeutic resistance. FEBS J. 2019;286:2870–82. [DOI] [PubMed] [Google Scholar]
- 56.Wang PF, Meng Z, Song HW, Yao K, Duan ZJ, Li SW, et al. Higher plasma fibrinogen levels are associated with malignant phenotype and worse survival in patients with glioblastomas. J Cancer. 2018;9:2024–9. [DOI] [PMC free article] [PubMed] [Google Scholar]
- 57.Dejana E, Languino LR, Polentarutti N, Balconi G, Ryckewaert JJ, Larrieu MJ, et al. Interaction between fibrinogen and cultured endothelial cells. Induction of migration and specific binding. J Clin Invest. 1985;75:11–8. [DOI] [PMC free article] [PubMed] [Google Scholar]
- 58.Tyagi N, Roberts AM, Dean WL, Tyagi SC, Lominadze D. Fibrinogen induces endothelial cell permeability. Mol Cell Biochem. 2008;307(1–2):13–22. [DOI] [PMC free article] [PubMed] [Google Scholar]
- 59.Gollapalli K, Ghantasala S, Kumar S, Srivastava R, Rapole S, Moiyadi A, et al. Subventricular zone involvement in Glioblastoma ‐ a proteomic evaluation and clinicoradiological correlation. Sci Rep. 2017;7:1449. [DOI] [PMC free article] [PubMed] [Google Scholar]
- 60.Baumann F, Leukel P, Doerfelt A, Beier CP, Dettmer K, Oefner PJ, et al. Lactate promotes glioma migration by TGF‐beta2‐dependent regulation of matrix metalloproteinase‐2. Neuro Oncol. 2009;11:368–80. [DOI] [PMC free article] [PubMed] [Google Scholar]
- 61.Xue Q, Cao L, Chen XY, Zhao J, Gao L, Li SZ, et al. High expression of MMP9 in glioma affects cell proliferation and is associated with patient survival rates. Oncology Letters. 2017;13:1325–30. [DOI] [PMC free article] [PubMed] [Google Scholar]
Associated Data
This section collects any data citations, data availability statements, or supplementary materials included in this article.
Supplementary Materials
FIGURE S1 Expression of stemness markers and self‐renewal capacity of BTICs. (A) The intracellular expression of stemness marker musashi1 in two BTIC lines by immunofluorescence staining of cells in culture. (B) Flow cytometry analysis of surface expression of stemness markers CD90 and nestin on live BTICs. (C) Sphere formation assay affirmed the self‐renewal capacity of BTICs
FIGURE S2 Effects of fibrinogen on human neural stem cells. Human neural stem cells isolated from brain tissues of human fetuses and human BTIC line BT073 were treated with different concentration of fibrinogen. (A) Cell growth were observed after 72 h using the IncuCyte Live Cell Analysis System. Representative of two independent experiments. (B) ATP proliferation assay of human NSCs and BT073 following treatment with fibrinogen for 72 hours. Data are represented as mean ± SEM (n of 6). *p < 0.05 and ****p < 0.0001 compared to control (one‐way ANOVA with Tukey's multiple comparisons). ns, not significant
FIGURE S3 Effects of fibrinogen on migration of differentiated GBM lines. (A) Bright‐field microscopy images of U251 GBM line, in the presence or absence of fibrinogen. Scale bars 50 µm. (B) Quantification of invasion in GBM lines (U251 and U87) following treatment with fibrinogen. ***p < 0.001 compared to control (one‐way ANOVA with Tukey's multiple comparisons)
MOVIE S1 Bright‐field time‐lapse live imaging of BTICs after treatment with fibrinogen (20 µg/ml) and observed over a 46.5‐hour period in 30‐minute intervals using the IncuCyte Live Cell Analysis System. Representative of two independent experiments. The time each image was taken is located in the bottom right corner. Scale bar 200 µm
Data Availability Statement
We confirm that the primary data of this manuscript will be made available for sharing when requested.


