FIGURE 6.

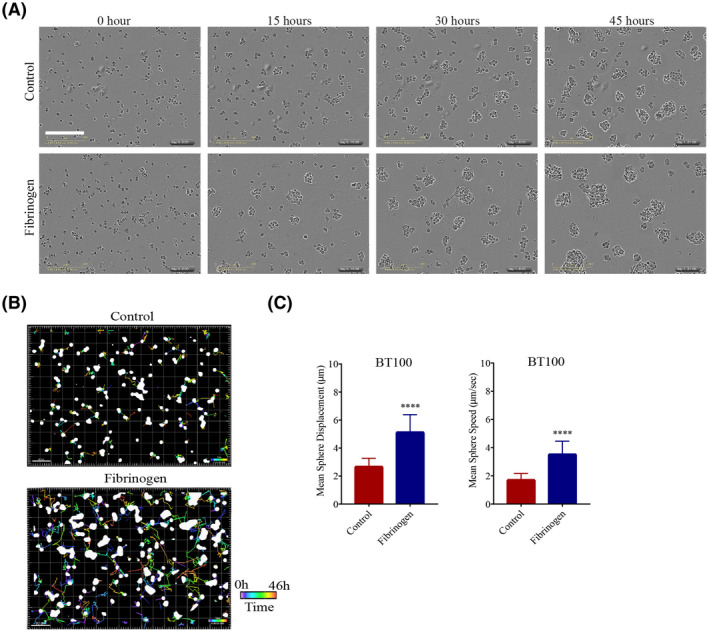
Fibrinogen modulates motility and invasiveness of BTICs in culture. (A) Bright‐field microscopy images of BT100 cultured with or without fibrinogen (20 µg/ml), captured in 15‐hour increments over a period of 45 h using the IncuCyte Live Cell Analysis System in two independent experiments. Please see Movie S1 for video. (B) BTIC sphere tracks depicting the movement of the spheres over a 46.5‐hour period under control or fibrinogen culture conditions in two independent experiments. The colored lines indicate the movement of the spheres over time. The time bar is shown in the bottom right corners of the images. Scale bars 80 µm. (C) Quantification of BTIC sphere displacement when BTICs were cultured in the presence of fibrinogen (20 µg/ml) versus control. Data are represented as mean ± SEM (n of 4). ****p < 0.0001 (Student's t‐test)
