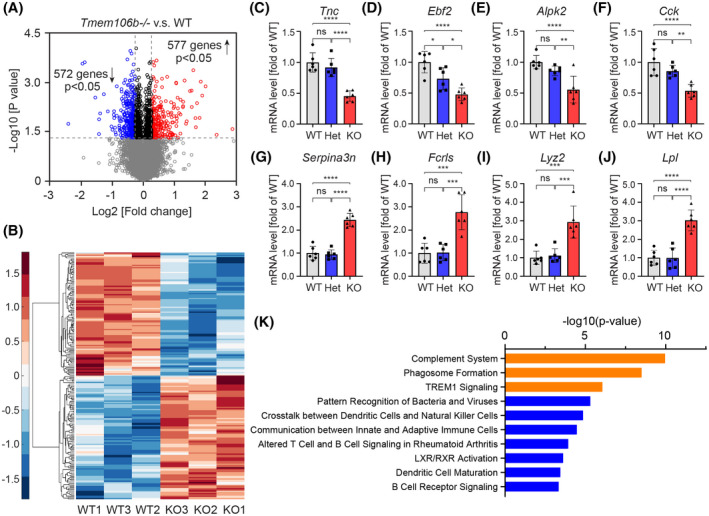
FIGURE 2.

Transcriptomic analysis of cerebellar tissue of Tmem106b−/− and WT mice. (A) Volcano plots show differentially expressed genes (DEGs) between Tmem106b−/− and WT mice using nominal significant p‐value < 0.05. Red and blue colors represent up‐regulated and down‐regulated genes in Tmem106b−/− mice, respectively. (B) Hierarchical clustering of top 100 up‐regulated and down‐regulated DEGs between Tmem106b−/− and WT mice. Red and blue colors represent upregulated and downregulated genes in Tmem106b−/− mice, respectively. (C–J) q‐PCR validation of selected down‐ (D–G) and up‐ (H–K) regulated DEGs using 15‐month‐old cerebellar tissue from WT, Tmem106b+/− (Het) and Tmem106b−/− (KO) mice. Graphs represent the mean ± SD. Data were analyzed by One‐way analysis of variance (ANOVA) followed by Tukey’s multiple comparison test (n = 6 per group). NS, no significant, **p < 0.01, ***p < 0.001, ****p < 0.0001. (K) Top 10 cellular processes identified by the ingenuity pathway analysis from the DEGs between Tmem106b−/− and WT mice. The top three most significant cellular processes are highlighted in orange
