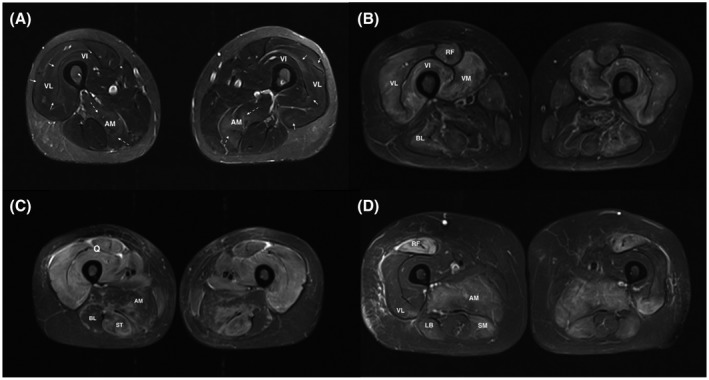
FIGURE 1.

High muscle T2 signals in myositis: (A) Muscle MRI of an overlap myositis (scleroderma) showing mild muscular inflammation. Normal muscles appear with a very low signal (close to the subcutaneous tissue after fat signal suppression). Inflammatory muscles exhibit high signal (slight) with blurred borders, clustered along the aponeuroses and muscular septa (full arrows). The dashed arrows show an area with a more intense hypersignal. (B) Myositis with moderate to severe muscle inflammation. MRI of a dermatomyositis patient showing hyperintense areas affecting mainly the four heads of the quadriceps muscle. (C) ASyS patient with severe muscle inflammation, displaying a marked T2 hyperintensity affecting all three compartments of the thighs on both sides. (D) MRI of an IMNM patient showing that hypersignal is also present when muscle fiber necrosis occurs in absence of significant inflammatory cell infiltratation. All pictures show thigh muscles MRI images (axial plane, T2 STIR w. seq). AM, Adductor magnus; LB, long biceps femoris; Q, quadriceps muscle; RF, rectus femoris; ST, semi‐tendinosus hamstring muscle; VI, vastus intermedius; VL, vastus lateralis; VM, vastus intermedialis
