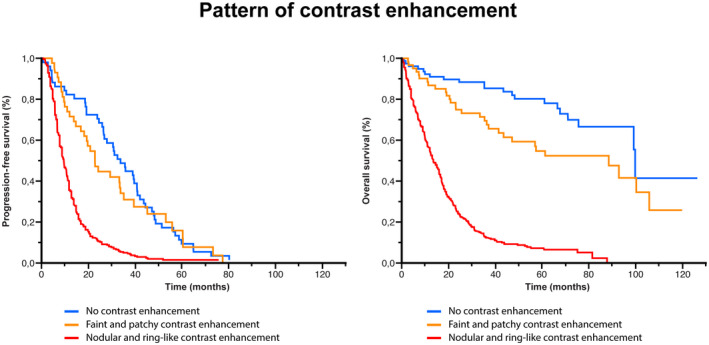
FIGURE 6.

Comparison of survival analyses according to the pattern of contrast enhancement (CE). Kaplan–Meier estimates of PFS and OS according to the pattern of CE. The median PFS was significantly longer in the non‐enhancing tumor subgroup (33.9 months) than in the faint and patchy CE subgroup (23 months) and the nodular and ring‐like CE subgroup (10 months) (p < 0.001). The median OS was significantly longer in the non‐enhancing tumor subgroup (99.4 months) than in the faint and patchy CE subgroup (88.2 months) and the nodular and ring‐like CE subgroup (13.5 months) (p < 0.001)
