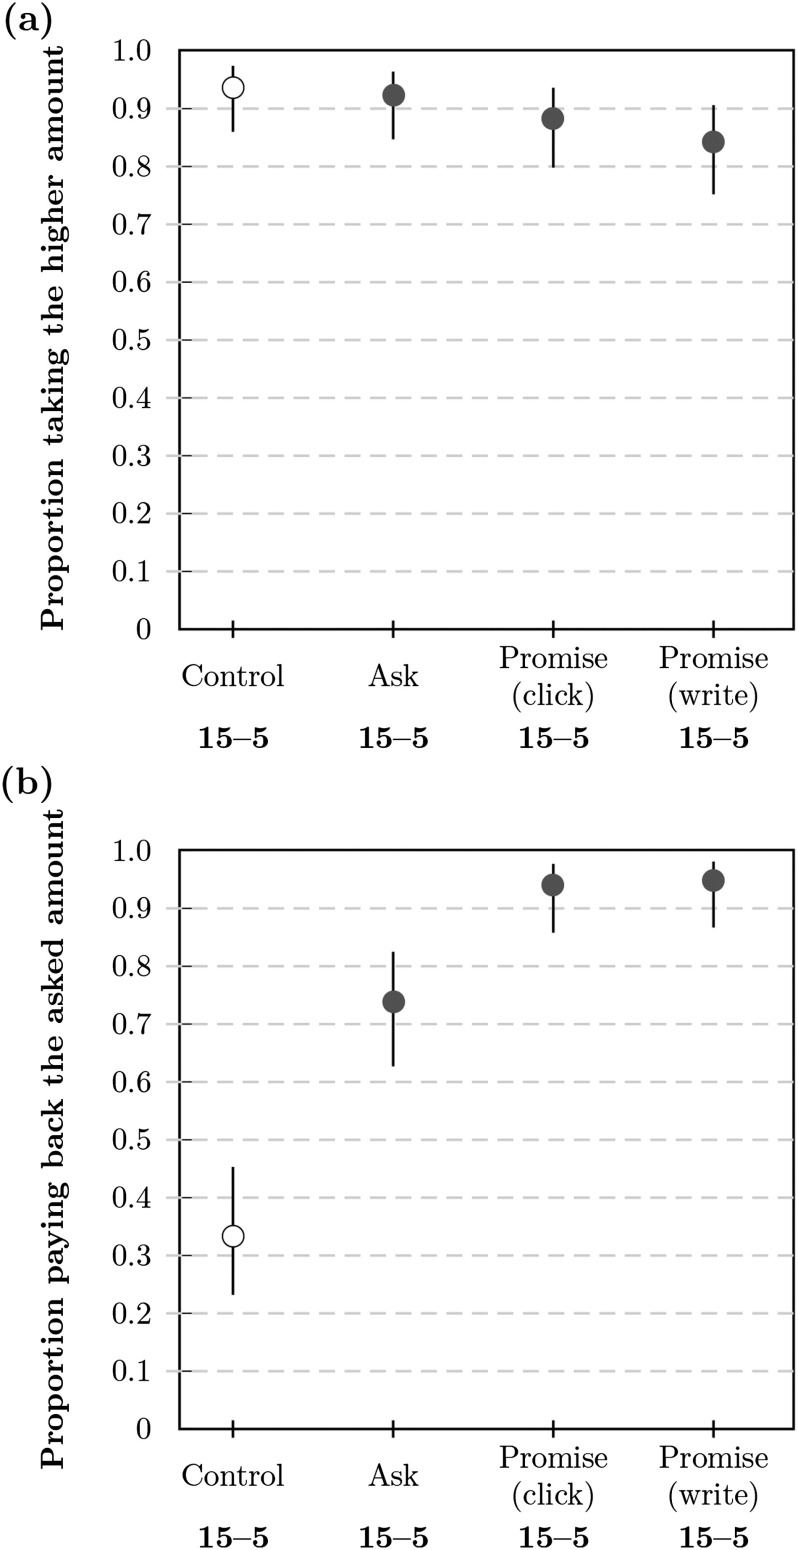
Figure 1. .
Proportion of participants in Study 1a (a) accepting the higher amount of $0.15 in the beginning and (b) repaying ≥$0.05 at the end. Proportions are shown as markers for each condition with bars corresponding to the 99% CI (confidence interval). The payback proportion is relative to the number of participants accepting the higher amount.

