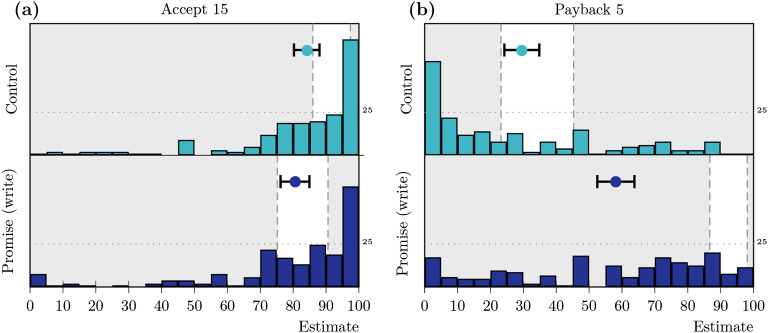
Figure 2. .
Distribution, means, and confidence intervals (CIs) for the (a) estimated acceptance and (b) estimated payback rates in Study 1b. The histograms show the distributions of individual estimates, the markers represent mean estimates, and whiskers correspond to the 99% CI for the mean. The nonshaded areas mark the CIs for the observed rates in Study 1a.

