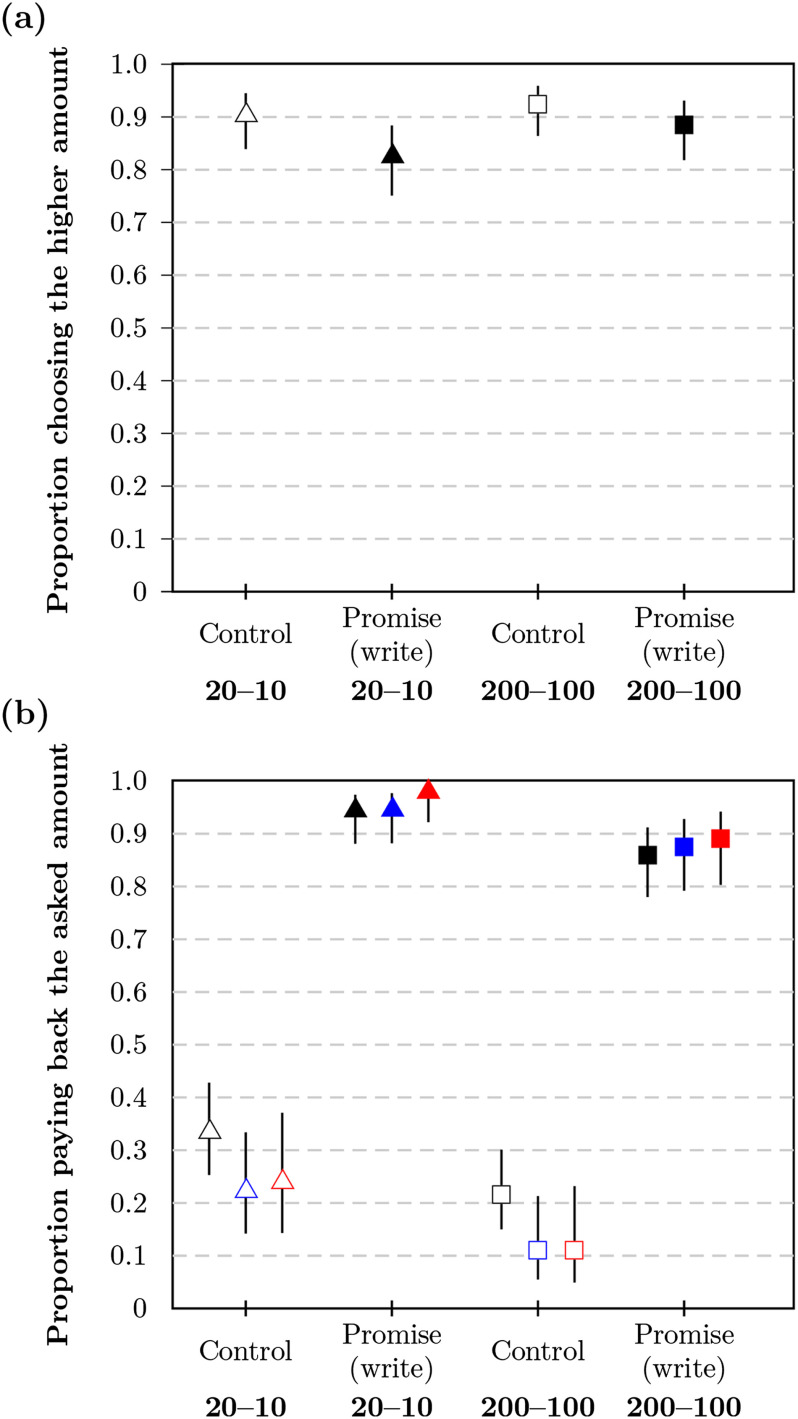
Figure 3. .
Proportion of participants (a) accepting the higher payment and (b) paying back at the end in Study 2a. Proportions are shown as markers for each condition with bars corresponding to the 99% CI (confidence interval). The payback proportion is relative to the number of participants accepting the higher amount. Payback rates are presented with different filters applied based on comprehension check performance: no filter (black), lenient filter (blue), and strict filter (red).

