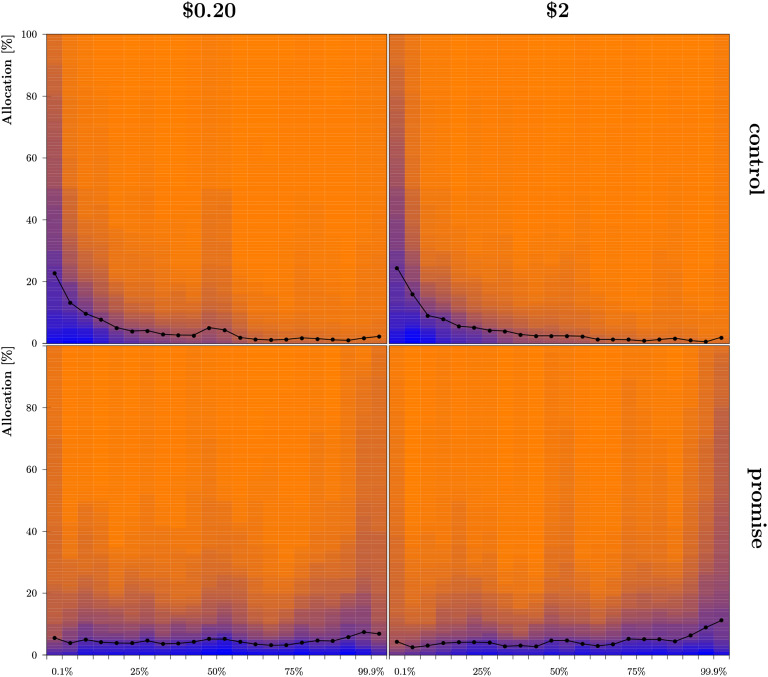
Figure 4. .
Distribution and means for individual subjective probability distributions in Study 2b for low stakes (left) and high stakes (right) crossed with control (top) and promise (bottom) conditions. Markers correspond to the average allocations to each interval; blue shading corresponds to the number of participants who committed at least the shaded amount of points to the respective interval.

