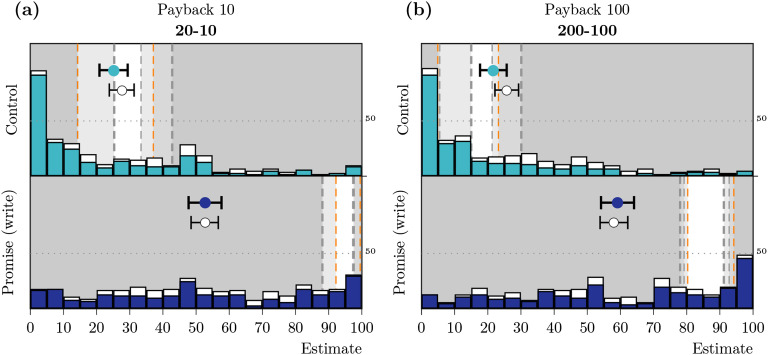
Figure 5. .
Distribution, means, and confidence intervals (CIs) for estimated payback rates in Study 2b. The histogram shows the distribution of individual estimates for both promise conditions (top and bottom) for (a) low stakes and (b) high stakes. Histograms represent the distributions of calculated individual point estimates. The markers show the mean estimate and whiskers correspond to the 99% CI for the mean (the filled marker for consistent participants, the unfilled marker for all participants). Different degrees of shading delimit the CIs for the corresponding rates observed in Study 2a, with the interval marked by orange lines for the strict filter, black for the lenient filter, and gray for no filter.

