
Figure 5:
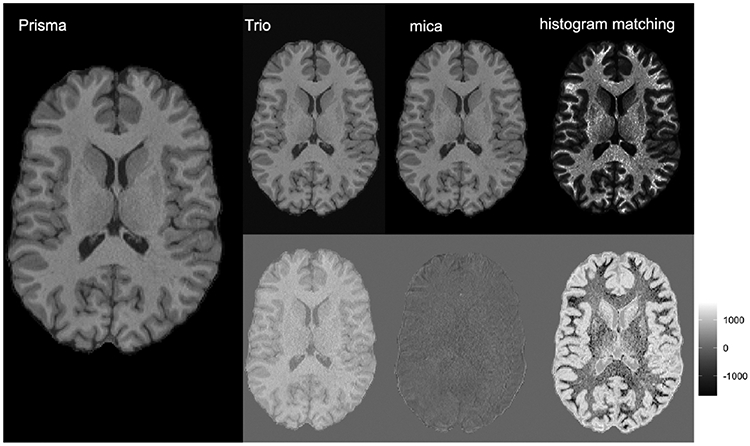
Axial slice of skull-stripped, T1-weighted images from a single subject in the trio2prisma dataset. At left is an image collected on the Prisma scanner. The top row from left to right show an image collected on the Trio scanner that has been spatially registered to the Prisma image, the Trio image after mica harmonization, and the Trio image after histogram matching, respectively. The bottom row shows image residuals indicating the voxelwise differences between the Prisma image and the Trio, mica harmonized, and histogram matching normalized images, respectively.