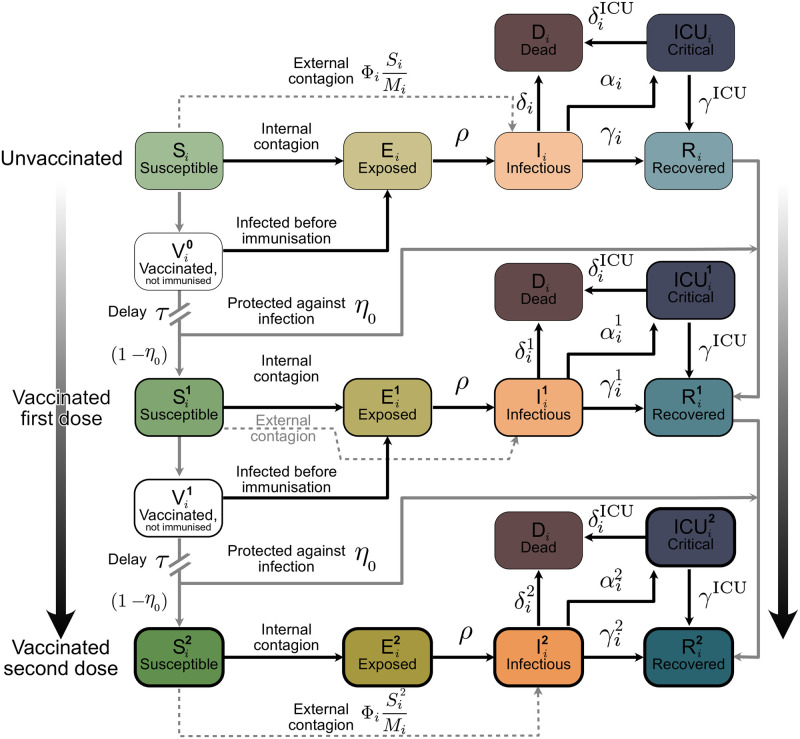
Fig 6. Scheme of our age-stratified SEIRD-ICU+vaccination model.
The solid blocks in the diagram represent different SEIRD compartments. Solid black lines represent transition rates of the natural progression of the infection (contagion, latent period, and recovery). On the other hand, dashed lines account for external factors and vaccination. Solid gray lines represent non-linear transfers of individuals between compartments, e. g. through scheduled vaccination. From top to bottom, we describe the progression from unvaccinated to vaccinated, with stronger color and thicker edges indicating more protection from the virus. Subscripts i indicate the age groups, while superscripts represent the number of vaccine doses that have successfully strengthened immune response in individuals receiving them. Contagion can occur internally, where an individual from age group i can get infected from an infected person from any age group, or externally, e. g., abroad on vacation. If the contagion happens externally, we assume that the latent period is already over when the infected returns and, hence, they are immediately put into the infectious compartments .

