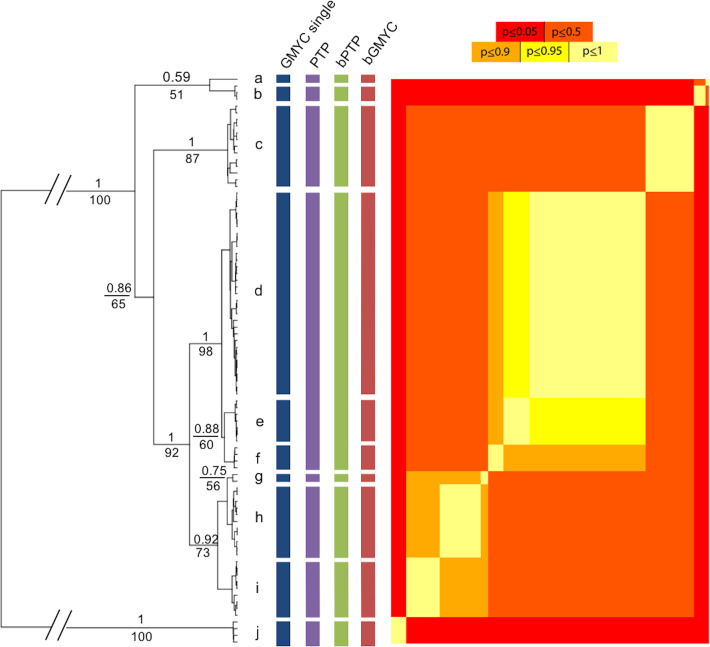
Fig 2.
To the left is the maximum clade credibility tree from the Bayesian analyses based on cytochrome oxidase subunit 1 (COI) sequences with results of the single threshold GMYC model (blue vertical lines), bGMYC (red vertical lines), PTP (purple vertical lines) and bPTP (green vertical lines). Values above tree branches are Bayesian posterior probabilities/maximum likelihood bootstrap values. To the right the heat-map represents a sequence-by-sequence matrix where cells are coloured by the posterior probability that the corresponding sequences are conspecific, allowing for the visualisation of uncertainty in species limits returned by the bGMYC method. The letters correspond to clades a = Mytilus californianus from USA (Monterrey Bay); b = Mytilus coruscus from China (Zhouhan); c = Mytilus trossulus from USA (Damariscotta and Penn Cove) and Canada (Mahome Bay and Bras d’Or Lake); d = Mytilus chilensis from Chile (Maullín, Quillaipe Puerto Saavedra, Caleta Pescadores, Huildad, Estero Fanny, Isla London, Chaihuín, San Gregorio and Puerto Cisne), Argentina (Mar del Plata and Punta Peña), Uruguay (Punta del Este) and Kerguelen island; e = Mytilus spp. from Australia (Tura Head and Green Cape) and Tasmania (Cloudy Bay, Hobart, Simpson’s Bay and Snug); f = Mytilus spp. from New Zealand (Auckland Islands, Dunedin and Wellington), g = Mytilus spp from N/A and Finland (Hanko); h = Mytilus galloprovincialis from Italy (Chioggia), Greece (Samos), Australia (Green Cape, Nedlands, Tura Head), South Africa (Paternoster), Chile (Dichato, Lota); i = Mytilus edulis from Sweden (Tjárno), USA (Beaufort), Canada (Antigonish), Argentina (Punta Cueva) and the Falkland Islands (Bense Island); j = outgroup Choromytilus chorus from Chile (Colún).

