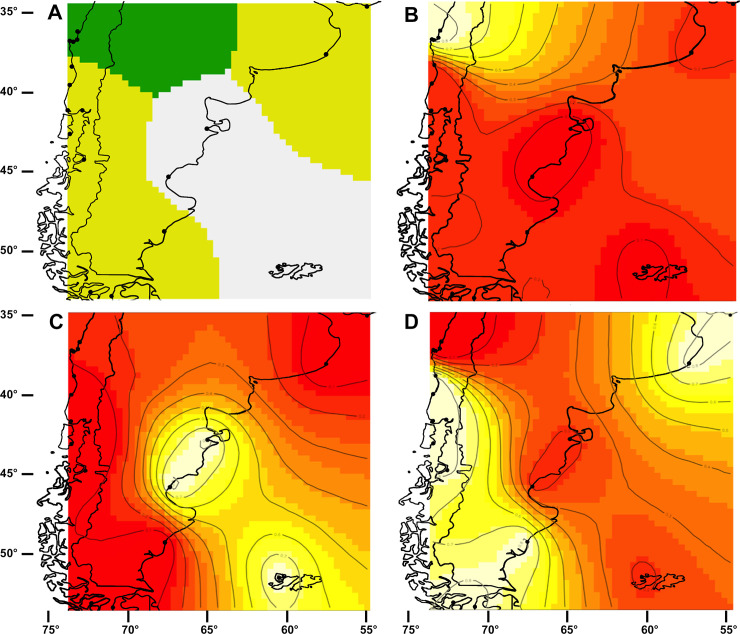
Fig 4. Geneland results for K = 3 groups using the spatial model with correlated allele frequencies (based on COI).
(A) Map of estimated posterior probability of population membership (by posterior mode)–different colours represent distinct genetic groups; plots representing the assignment of pixels to: B) introduced Mytilus galloprovincialis in Chile, (C) mussels from the Atlantic coast of South America, and (D) M. chilensis mussels from the Pacific and southern Atlantic coasts of South America. The highest membership values are in white and light yellow and the contour lines indicate the spatial position of genetic discontinuities between populations.

