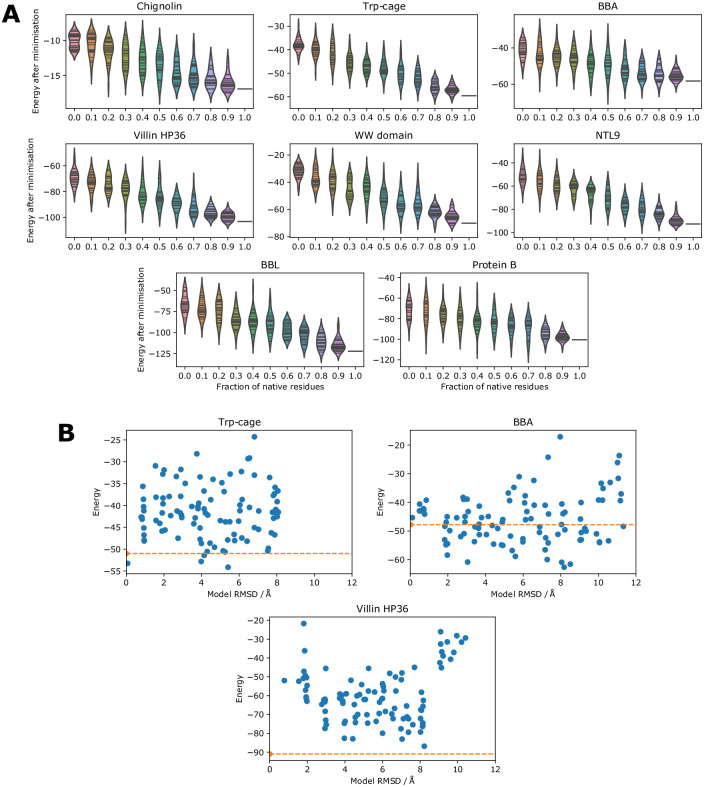
Fig 5. Protein design and model scoring.
(A) The energy of sequences with varying fractions of native residues threaded onto the native structure. 30 sequences are scored for each fraction. A short minimisation of 100 steps is carried out for each sequence and the energy is recorded at the end of the minimisation. (B) The energy of well-packed decoys generated using 3DRobot is compared to the Cα RMSD of the decoys (blue dots) and the energy of the native structure (orange line). Chignolin was too small to run 3DRobot on.

